. 2021 Jul 27;10:e65128. doi: 10.7554/eLife.65128

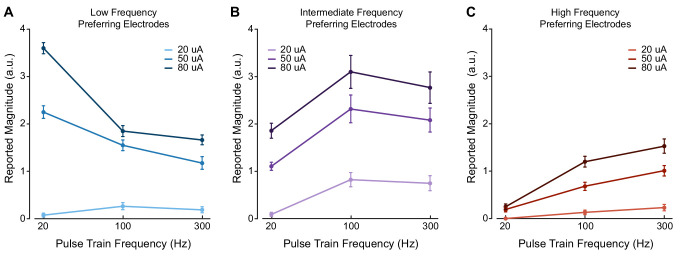
Figure 2. Stimulus current amplitude does not change the relationship between pulse frequency and intensity at suprathreshold amplitudes.

Magnitude estimation data for different current amplitudes and pulse frequencies. Data were aggregated across electrodes by their category, where each plot shows a different category of electrodes. Perceived intensity values for (A) LFP electrodes, (B) IFP electrodes, and (C) HFP electrodes at different current amplitudes and pulse frequencies. Different colored bars represent different current amplitudes. Error bars indicate the standard error across electrodes. We tested two LFP electrodes, three IFP electrodes, and two HFP electrodes which were each tested twice in different sessions.

Figure 2—source data 1. This file contains all the magnitude estimation data from participant P2 using amplitudes of 20, 50, and 80 μA and frequencies of 20, 100, and 300 Hz.
Each sheet contains data for a for one of the three frequency preference groups (LFP, IFP, or HFP). Each sheet contains information about the electrode number, post-implant day, stimulation amplitude, stimulation frequency, the participant’s response, and the block for each data point.

Figure 2.

Figure 2—figure supplement 1. Higher pulse frequencies always improved detection at perithreshold current amplitudes.
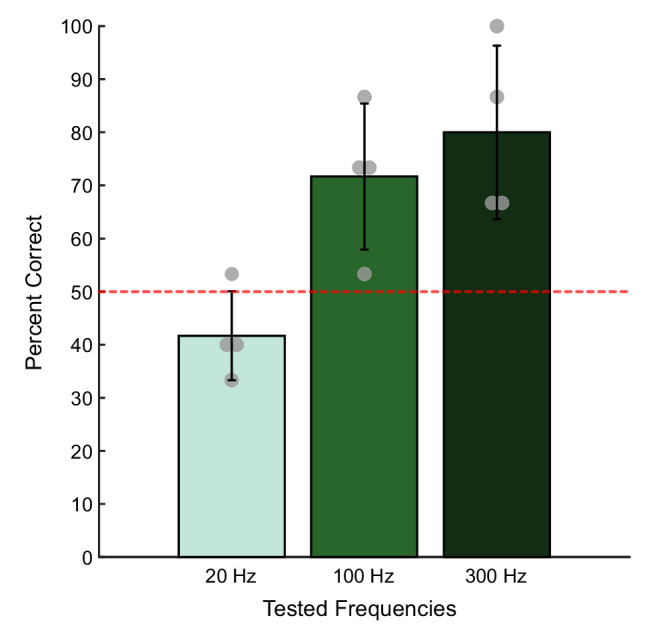
Figure 2—figure supplement 1.

Bar plots showing the probability of correctly identifying the window containing a stimulus train with different pulse frequencies at a fixed perithreshold current amplitude (6–16 μA). Each bar represents the mean detection accuracy at each pulse frequency on four tested electrodes. The error bar indicates the standard deviation. The gray dots show the individual electrode performance accuracies. Chance performance was 50% and is indicated with the red dotted line.
Figure 2—figure supplement 1—source data 1. This file contains all the data from participant P2 for a detection task conducted at perithreshold amplitudes.
The file contains the electrode number, stimulation amplitude, stimulation frequency, the train that was selected (response), the order in which the reference train was presented, whether the participant correctly identified the interval with stimulation (success), and block for each trial.