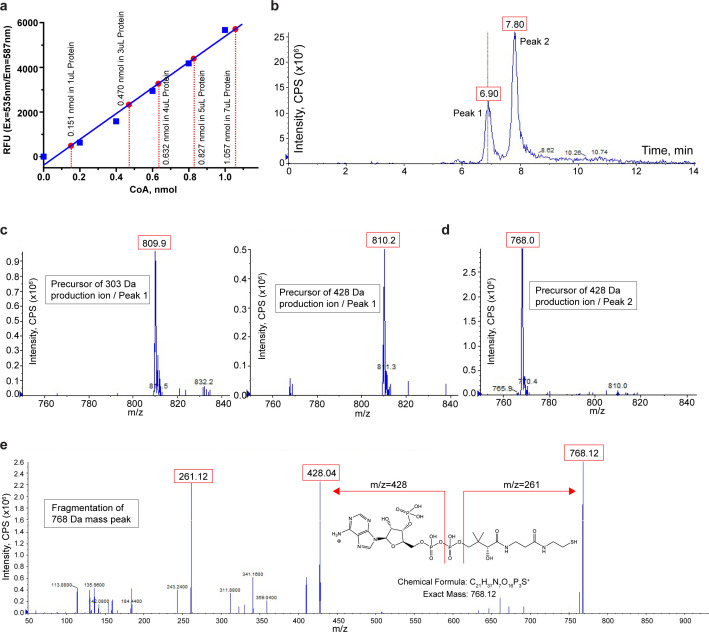
Figure 5. Biochemical and mass spectrometry assay of CoA in TMEM120A.
(a) Coenzyme A (CoA) assay. A blue standard curve is obtained from fluorometric measurements of various amounts of pure CoA provided in the assay kit. Red dots mark the measured CoA contents in 1, 3, 4, 5, and 7 μl of protein samples. The measure of CoA concentration in 4 mg/ml protein sample is 0.1564 ± 0.0027 mM (mean ± SEM, n = 5). (b) Liquid chromatography (LC) separation of extracted substrates from TMEM120A protein sample in liquid chromatography-tandem mass spectrometry (LC-MS/MS). (c) Precursor ion scan of peak 1 effluent using 303 Da (left) and 428 Da (right) fragments. (d) Precursor ion scan of peak 2 effluent using 428 Da fragments. (e) Fragmentation (product ion scan) of the 768 Da mass peak.

