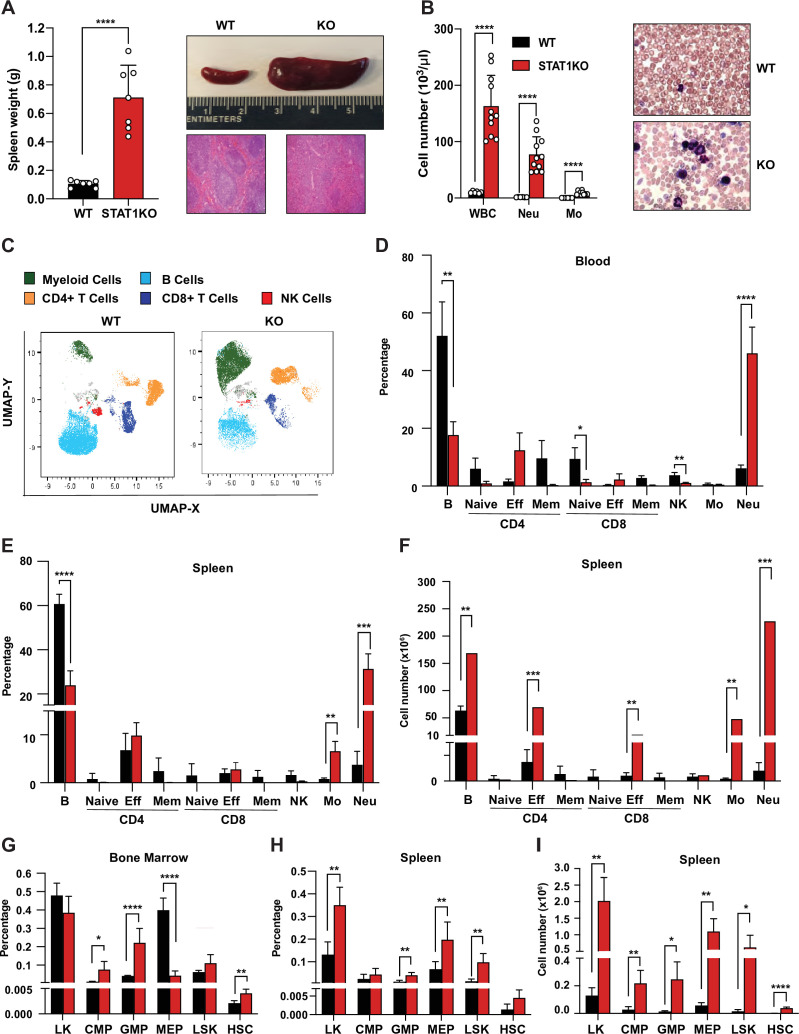
Figure 1. Characterization of STAT1 KO hematopoietic defects.
(A) Spleen weights in g (n = 7), mean ± SD (left). Representative spleen of a STAT1 KO mouse and its age- and sex-matched WT littermate (top right). Representative histology of STAT1 KO and WT spleens, stained with H&E (bottom right). (B) Total WBC, neutrophil and monocyte counts (n = 6 WT, n = 11 KO), mean ± SD (left). Representative blood smear from WT and STAT1 KO blood after Giemsa staining (right). (C) Uniform Manifold Approximation and Projection (UMAP) plots of blood from WT and STAT1 KO littermates after 18-color multi-parameter flow cytometry staining. Clusters were annotated using known markers. Flow cytometric analysis of blood (D), bone marrow (G), spleen (E–H) of STAT1 KO, and WT littermates (n = 4–5). Values represent mean ± SD of live cells, percentage or number, as indicated. *p<0.05, **p<0.01, ***p<0.001, ****p<0.0001 by Student’s t-test. NK, natural killer; LK, lin−Sca1−c-Kit+; CMP, common myeloid progenitor; GMP, granulocyte-macrophage progenitor; MEP, megakaryocyte-erythroid progenitor; LSK, lin-Sca1+c-Kit+; HSC, hematopoietic stem cells. Each dot represents an individual animal (A, B).


