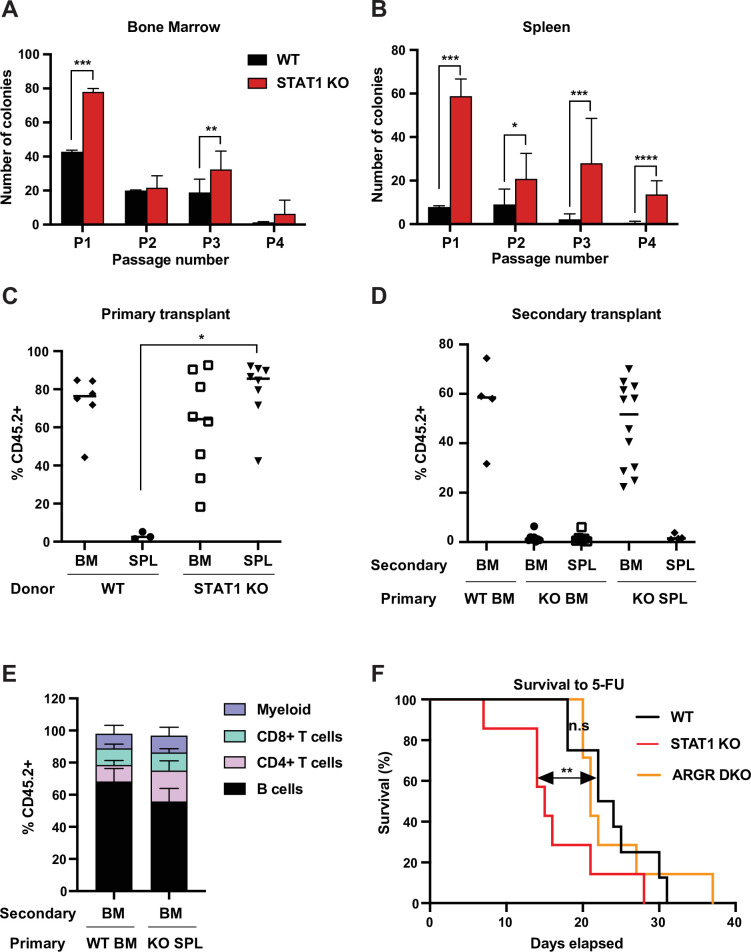
Figure 2. STAT1-deficient spleens harbor a large number of definitive HSCs.
In vitro self-renewal colony forming assay of hematopoietic progenitors from bone marrow (A) or spleen (B) after serial plating (n = 3 mice, each plating in triplicate). Values represent mean number of colonies ± SD. Each replating culture was inoculated with equal numbers of cells. Quantification of donor-derived (CD45.2) cells, provenance as indicated, in the peripheral blood of recipient CD45.1 animals 1 month after primary transplant (C) or 4 months after secondary transplant (D). Values represent individual animals. (E) Quantification of donor-derived (CD45.2) B (B220+) cells, T (CD4+ or CD8+), and myeloid (CD11b+) cells in the peripheral blood of recipient animals 4 months after secondary transplant ; values represent mean ± SD; WT n = 4 mice; KO n = 11 mice. (F) Kaplan–Meier survival curve of WT, STAT1 KO, and ARGR DKO mice after weekly injections of 5-fluorouracil (5-FU). WT n = 5 mice, STAT1 KO and ARGR DKO n = 7 mice. *p<0.05, **p<0.01, ***p<0.001, ****p<0.0001 by Student’s t-test or Gehan–Breslow–Wilcoxon test for Kaplan–Meier.

