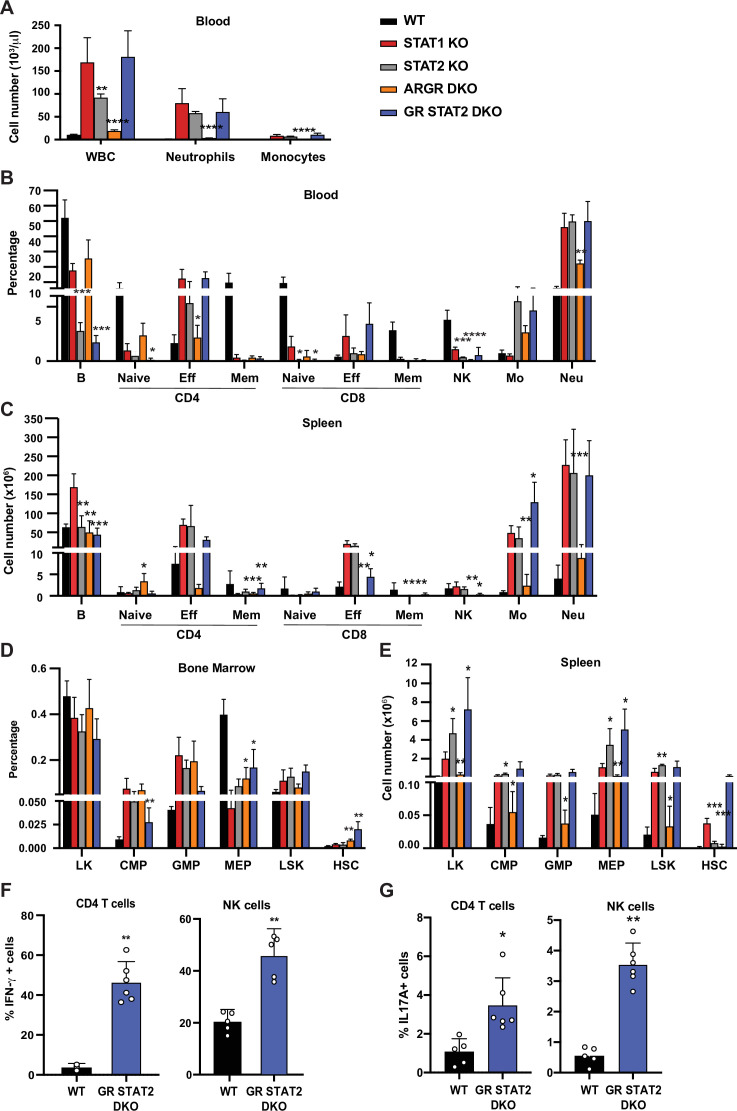
Figure 4. Combined IFN type I, II, III response deficiency recapitulates STAT1 deficiency.
(A) Total WBC, neutrophils, and monocytes counts using Hemavet in blood from WT, STAT1 KO, STAT2 KO, ARGR DKO, and GR STAT2 DKO mice (n = 5–10 mice/group). Quantification by flow cytometry of mature cell populations from blood (B), spleen (C), and progenitor populations from bone marrow (D) and spleen (E) from WT, STAT1 KO, STAT2 KO, ARGR DKO, and GRSTAT2 DKO (n = 4 or 5). Same legend as in (A). Statistical comparison is between each genotype and STAT1 KO. Percentage of IFN-γ- (F) or IL-17A-producing (G) CD4+ T cells (left) or NK cells (right) in GR STAT2 DKO and WT mice (n = 4–6). Values represent mean ± SD of live cells, percentage or number, as indicated. *p<0.05, **p<0.01, ***p<0.001, ****p<0.0001 by Student’s t-test. NK, natural killer; LK, lin−Sca1−c-Kit+; CMP, common myeloid progenitor; GMP, granulocyte-macrophage progenitor; MEP, megakaryocyte-erythroid progenitor; LSK, lin−Sca1+c-Kit+; HSC, hematopoietic stem cells. Each dot represents an individual animal (F, G).
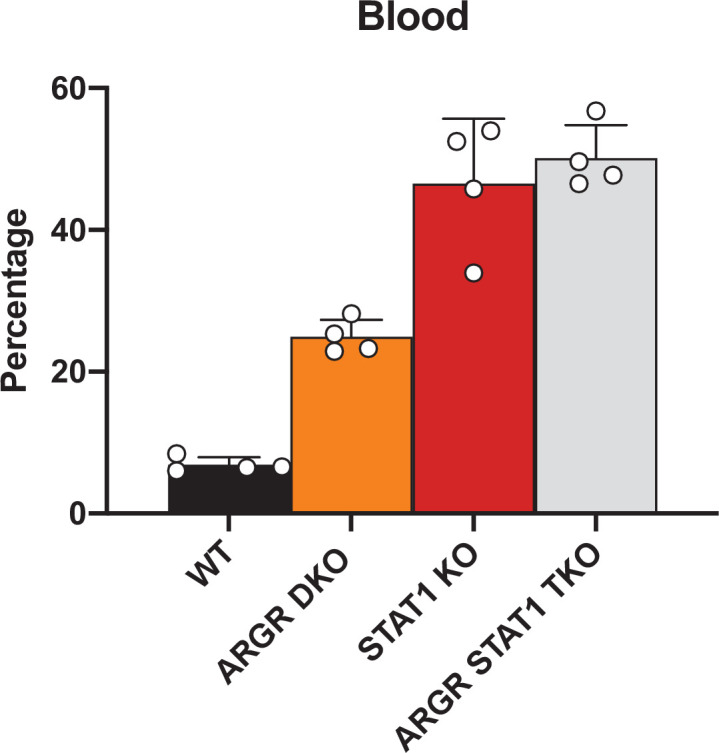
Figure 4—figure supplement 1. Flow cytometric analysis of myeloid cells in WT, STAT1 KO, ARGR DKO, and ARGR STAT1 TKO animals.


