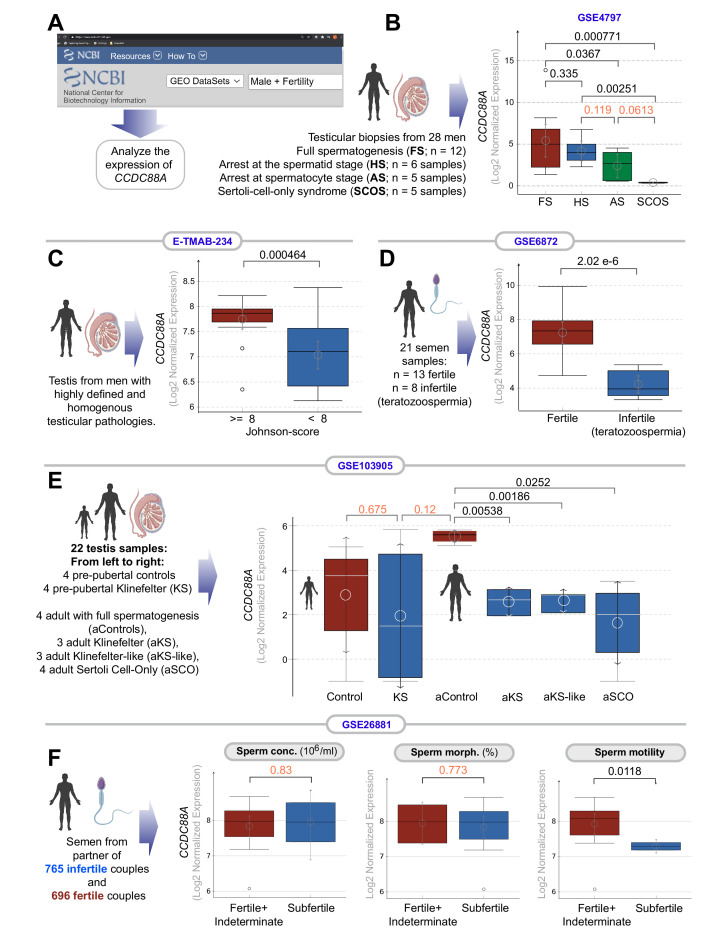
Figure 2. Transcripts of CCDC88A (GIV) are downregulated in infertile male testis and semen.
(A) Schematic displays the approach used to search NCBI GEO database for testis and sperm transcriptomic datasets suitable to study correlations between the abundance of CCDC88A transcripts and male fertility. (B–E) Whisker plots show the relative abundance of CCDC88A (expressed as Log2 normalized expression; see Materials and methods for different normalization approaches used for microarray and RNA-seq datasets) in sperm or testis samples (as annotated using schematics) in samples annotated with fertility status, or syndromes associated with infertility. (F) Whisker plots show the relative abundance of CCDC88A transcripts in sperms classified as subfertile or not based on three properties of sperm assessed using a modified WHO criterion published by Guzick et al., 2001 (see Materials and methods). Distribution of gene expression values is illustrated using boxplots and mean as circle with 95% confidence intervals (CIs) as arrows. Numbers on top indicate the p values, which were derived from Welch’s t-test. A significance level of <0.05, corresponding to 95% CIs are indicated in black font. Insignificant p values are indicated in red font.

