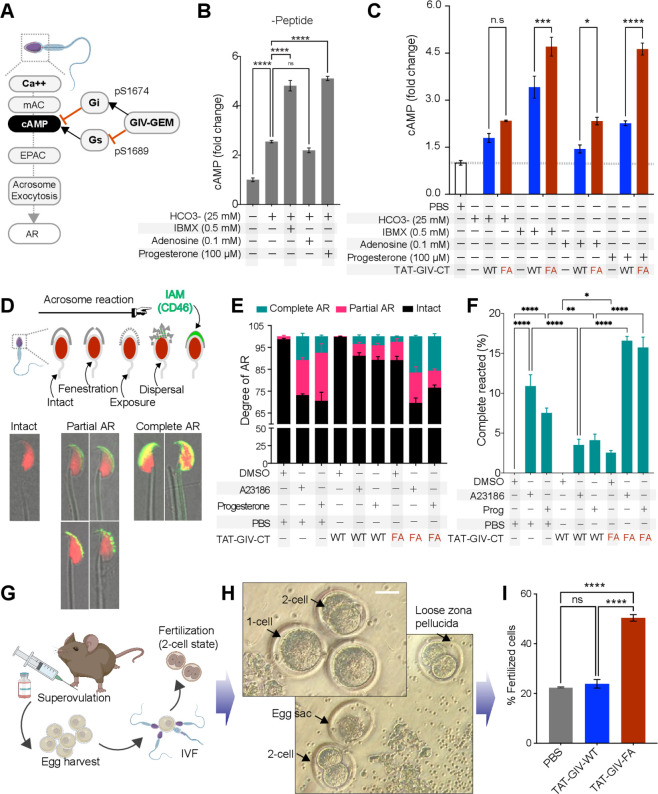
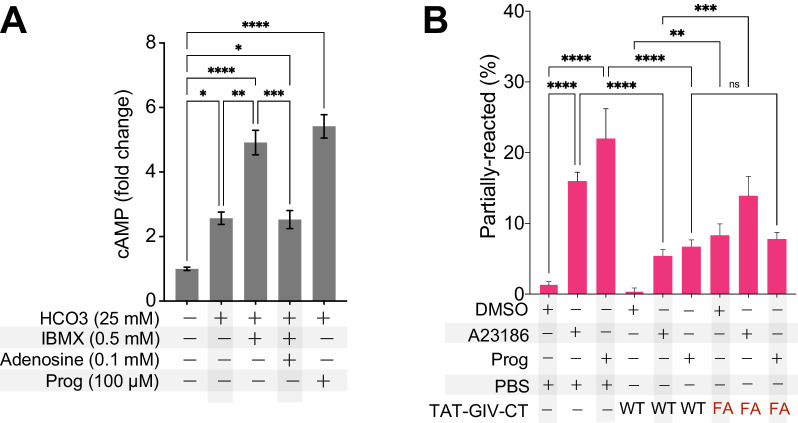
Figure 7. GIV’s GEM function inhibits acrosomal reaction (AR).
(A) Schematic summarizes the current knowledge of how Ca2+ and cAMP signaling regulates acrosome exocytosis during AR and how GIV’s ability to modulate cAMP via both Gαi/s is hypothesized to impact AR. (B) Bar graphs display the fold change in cAMP in mouse sperms treated with various stimuli in the presence of DMSO. All results are presented as average ± SEM of three independent studies conducted on sperm isolated from three mice. Statistical significance was assessed using one-way analysis of variance (ANOVA) followed by Tukey’s test for multiple comparisons. nsp>0.05, ****p<0.0001. (C) Bar graphs display the fold change in cAMP in TAT-GIVCT-transduced mouse sperms exposed to various stimuli. Dotted horizontal line represents cAMP concentration in PBS-treated samples, to which all other values were normalized. See also Figure 7—figure supplement 1 for comparison of PBS vs. all other treatments and conditions with (+) or without (-) peptides. All results are presented as average ± SEM of three independent studies conducted on sperm isolated from three mice. Statistical significance was assessed using two-way ANOVA followed by Sidak’s test for multiple comparisons. *p<0.05, ***p<0.001, ****p<0.0001, nsp>0.05 (Figure 7—source data 1). (D) Schematic on top summarizes the assay used to quantify progressive changes in acrosome membrane during AR that was induced in vitro by exposing capacitated sperms to 10 µM A23186 or 100 µM progesterone. Images in the bottom panel are representative of acrosome-intact, partial AR and complete AR stages. (E, F) Stacked bar graphs in (E) display the proportion of sperms in each indicated condition that are either in partial or complete AR or with intact acrosomes. Bar graphs in (F) display just the relative proportion of sperms in (E) that have complete AR. All results are presented as average ± SEM of three independent studies conducted on sperm isolated from three mice. Statistical significance was assessed using one-way ANOVA followed by Tukey’s test for multiple comparisons. *p<0.05, **p<0.01, ****p<0.0001 (Figure 7—source data 2). (G–I) Schematic in (G) displays the workflow used for in vitro fertilization (IVF) assays in (H, I). Representative images in (H) display the two-cell stage, which is quantified as % of total eggs in the assay and displayed as bar graphs in (I) as an indication of successful fertilization. Results are presented as average ± SEM of three independent studies conducted on sperm isolated from three mice. Statistical significance was assessed using one-way ANOVA including a Tukey’s test for multiple comparisons. ****p<0.0001, nsp>0.05 (Figure 7—source data 3).


