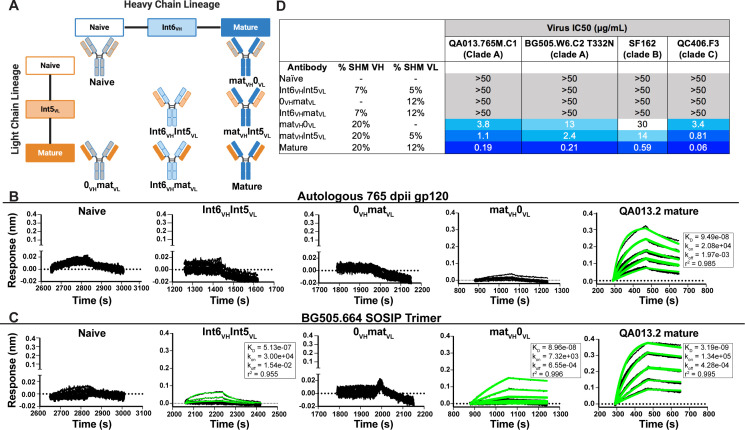
Figure 2. Binding and neutralization analyses of QA013.2 inferred VH and VL antibody chains demonstrates that heavy chain maturation is critical for bnAb function.
(A) Schematic depicting antibody chain pairings of inferred lineage member heavy (blue) and light chains (orange) with one another. (B,C) Biolayer interferometry (BLI) analysis of QA013.2 inferred lineage mAbs at 10 µg mL−1 binding to (B) the Env-gp120 monomer from a clade A autologous superinfecting virus variant from 765 dpii (QA013.765M.C1, 2 µM) and (C) the heterologous clade A Env trimer (BG505.SOSIP.664, 500 nM). All BLI curves were subjected to double reference background subtraction and data were fit to a global model of 1:1 ligand:analyte binding to obtain KD, kon, and kdis values. The resulting lines of best fit are shown in green. Dotted line across the graphs marks 0.00 on the y-axis. All data are representative of at least two independent experiments. (D) QA013.2 inferred lineage mAb neutralization of autologous and heterologous pseudoviruses as measured by the TZM-bl assay. The half maximal inhibitory concentration (IC50) for each tested pseudovirus is shown in a row across the top of the table. Darker blue indicates more potent neutralization, while white demonstrates weak neutralization, and grey represents no neutralization observed at the highest antibody concentration tested. Simian immunodeficiency virus (SIV) was used as a negative control; none of the tested mAbs showed evidence of SIV neutralization (data not shown). IC50 values are the average of at least two independent replicates. See Figure 2—figure supplement 1, Figure 2—source data 2, Figure 2—source data 3 and Figure 2—source data 1.


