. 2021 Jul 15;10:e68110. doi: 10.7554/eLife.68110

Figure 3. Cryo-EM structure of QA013.2 Fab bound to BG505.SOSIP.664 trimer.

(A) Cryo-EM reconstruction of QA013.2 Fab bound to BG505.SOSIP.664 trimer. Gp120 chains are shown in dark blue, gp41 in light blue, Fab heavy chain in orange, and Fab light chain in green. (B) Side-view of cryo-EM reconstruction with a single copy of the PDB model shown. The black oval indicates the region of interaction between QA013.2 Fab and HIV BG505 gp120 that is enlarged and highlighted in detail in panels C-E. (C) N332 glycan interaction with CDRL3 and CDRH3. (D) N301 glycan interaction with CDRH1 and CDRH2. (E) Heavy chain CDR3 interacts with the linear GDIR motif of gp120. See also Figure 3—figure supplements 1 and 2 and Figure 3—source data 1.

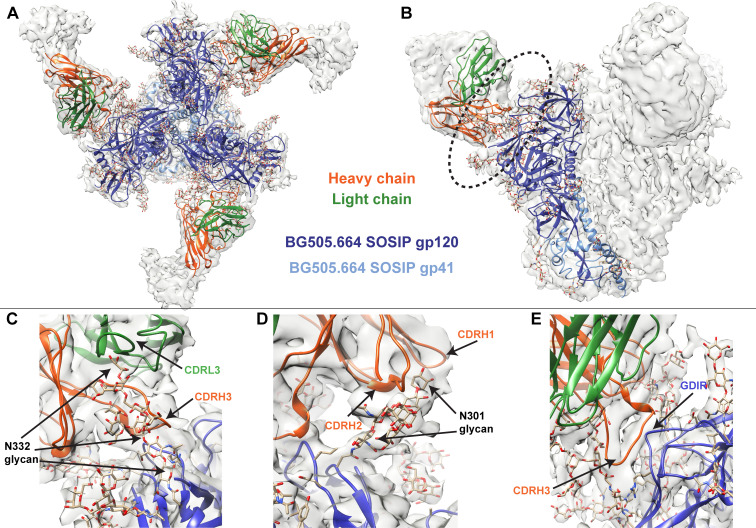
Figure 3—source data 1. BG505.SOSIP + QA013.2 Fab cryo-EM data collection, refinement parameters, and model statistics.
Figure 3—source data 2. BG505.SOSIP + QA013.2 Fab cryo-EM map and coordinates.

Figure 3.

Figure 3—figure supplement 1. Cryo-EM features of QA013.2 Fab heavy chain.

Figure 3—figure supplement 1.

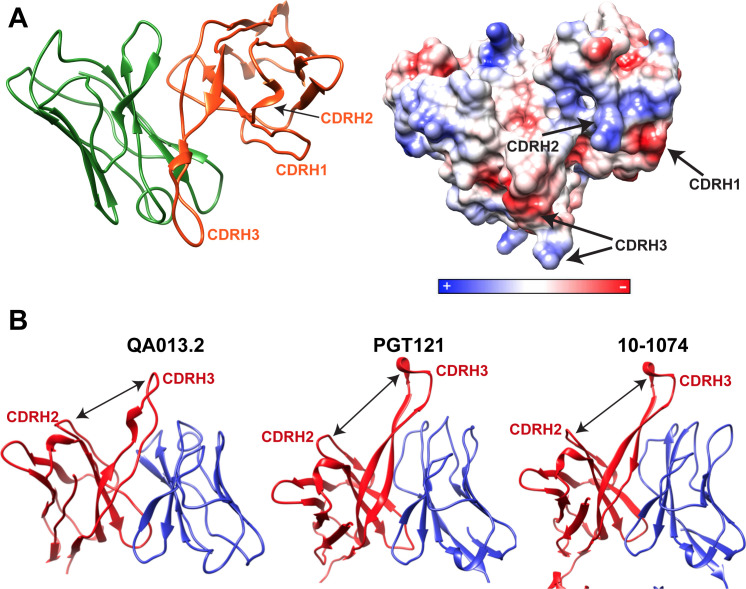
(A) Left: Ribbon diagram of Fab QA013.2. Light chain in green and heavy chain in orange. Right: Electrostatic coulombic surface coloring of QA013.2 Fab. Red areas indicate negative charge, blue areas indicate positive charge and white areas indicate non-polar regions. (B) QA013.2 Fab exhibits common quaternary architecture to other V3/glycan-specific bNAbs. Ribbon diagram of QA013.2 Fab model, crystal structure of Fab PGT121(PDB ID: 4FQ1), and crystal structure of Fab 10–1074 (PDB ID: 4FQ2). Heavy chains are colored in red and light chains in blue. Cleft formed between CDRH3 and the remainder of Fab heavy chain domain due to tilting toward the light chain is indicated by a black arrow (Mouquet et al., 2012).
Figure 3—figure supplement 2. Fourier Shell Correlation curves.

Figure 3—figure supplement 2.

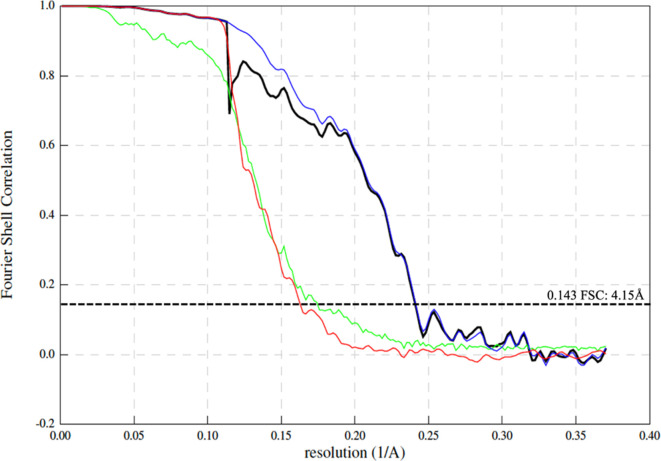
Lines representing correlation corrected (black), masked (blue), unmasked (green), and phase randomized (red) Fourier Shell correlation curve maps. Dashed line represents the ‘gold-standard’ FSC cutoff of 0.143.