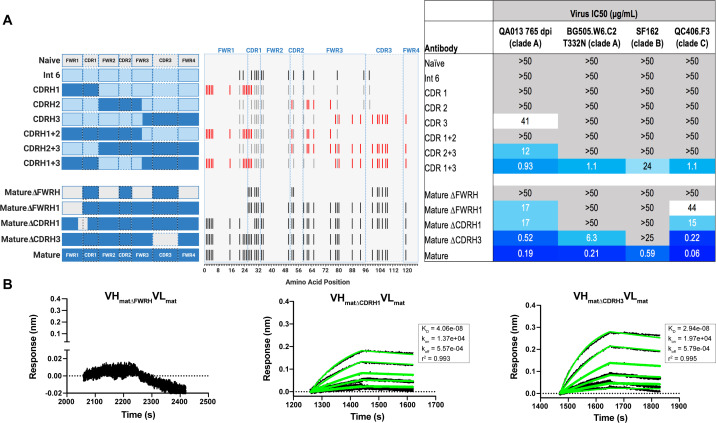
Figure 4. Interrogating the QA013.2 heavy chain paratope through binding and neutralization studies using chimeric antibodies.
(A) Schematic of heavy chain chimeras that were generated and paired with the mature light chain. Names of each heavy chain variant are listed on the left, with colored bars representing the VH region including FWR and CDR loops colored by lineage member to visualize how each variant was generated. Inferred naïve heavy chain is represented in grey, latest inferred heavy chain intermediate (Int6VH) is shown in light blue, and the mature heavy chain is shown in dark blue. The middle plot shows the individual mutations represented as black lines across VH relative to the inferred naïve BCR, with CDRs demarcated by dashed lines. Red lines represent all mutations added to the Int6VH template. Neutralization table on the far right shows the average IC50 values for each tested chimeric antibody across a panel of pseudoviruses shown at the top. Characteristics of the neutralization table are consistent with those listed in the Figure 2 legend. (B) Biolayer interferometry kinetic curves of a select subset of tested antibody variants (10 µg mL−1 against heterologous trimer - BG505.SOSIP.664 at 500 nM). BLI curves were analyzed as described in the Figure 2 legend. See Figure 4—source data 1, Figure 4—source data 2 and Figure 4—source data 3. See also Supplementary file 3 for fasta file of all chimeric and mutant VH and VL antibody chains used in Figures 4, 5, 6.

