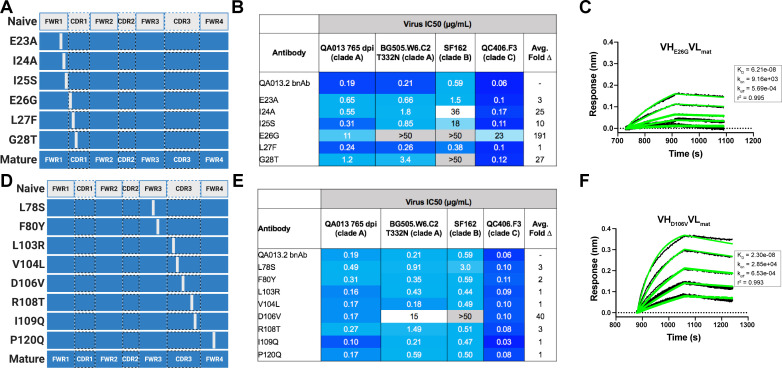
Figure 5. Binding and neutralization of VH point mutant antibodies demonstrates that residues spanning FWRH1-CDRH1 are essential for conferring bnAb neutralization breadth.
Schematic of heavy chain point mutants generated in (A) FWRH1-CDRH1 that were paired with the mature light chain. Names of each heavy chain point mutant are listed on the left, with colored bars representing the VH region including FWR and CDR loops (dashed lines) colored by lineage member to visualize how each point mutant was generated. Inferred naive heavy chain is represented in gray and the mature heavy chain is shown in dark blue. (B) FWRH1-CDRH1 point mutant neutralization of a subset of autologous and heterologous pseudoviruses as measured by the TZM-bl assay. IC50 values of each antibody are shown for each pseudovirus column, where darker blue indicates more potent neutralization and grey indicates no neutralization was observed at the highest antibody concentration tested. Average fold change in IC50 for a particular point mutant relative to the mature bnAb across all pseudoviruses is reported as a final column on the right. (C) BLI kinetic curve of a selected FWRH1-CDRH1 point mutant antibody E26G at 10 µg mL−1 against heterologous trimer (BG505.SOSIP.664 at 500 nM). (D) Schematic of CDRH3 mutants that were paired with the mature light chain. (E) CDRH3 point mutant neutralization of a subset of autologous and heterologous pseudoviruses as measured and displayed in panel B. (F) BLI kinetic curve of a selected CDRH3 point mutant antibody D106V at 10 µg mL−1 against heterologous trimer (BG505.SOSIP.664 at 500 nM). BLI curves were analyzed as described in the Figure 2 legend. See Figure 5—source data 1, Figure 5—source data 2 and Figure 5—source data 3.See also Supplementary file 3 for fasta file of all chimeric and mutant VH and VL antibody chains used in Figures 4, 5, 6.

