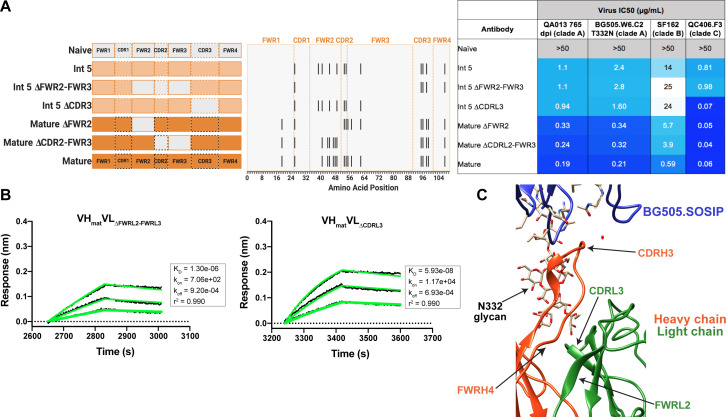
Figure 6. Construction of chimeric VL antibodies to investigate the contribution of QA013.2 light chain to bnAb breadth and potency.
(A) Schematic of light chain intermediates that were generated and paired with the mature heavy chain. Names of each light chain intermediate are listed on the left, with colored bars representing the VL region including FWR and CDR loops (dashed lines) colored by lineage member to visualize how each variant was generated. Inferred naïve light chain is represented in gray, latest inferred light chain intermediate (Int5VL) is shown in light orange, and the mature light chain is shown in dark orange. The plot in the middle shows the individual mutations across VL relative to the inferred naïve BCR, with FWR regions flanking CDR loops that are demarcated by dashed lines. Neutralization table on the far right shows the average IC50 values for each tested intermediate against a panel of pseudoviruses grouped by clade shown at the top. Characteristics of the neutralization table are the same as those listed in the Figure 2 legend. (B) Biolayer interferometry kinetic curves of a select subset of tested antibody variants (10 µg mL−1 against heterologous trimer BG505.SOSIP.664 at 500 nM). BLI curves were analyzed as described in the Figure 2 legend. All data are representative of at least two independent experiments. (C) Ribbon structure of QA013.2 Fab bound to BG505.SOSIP.664 Env trimer. Protruding N332 glycan on BG505.SOSIP.664 trimer is shown as a stick model, Fab heavy chain is shown in orange, and Fab light chain in green. Key regions of the structure are labeled including the N332 glycan as well as the VL regions that contribute to bnAb potency and antibody-antigen complex formation. FWRL2 interacts with FWRH4 of the heavy chain, while CDRL3 appears to interact with the tip of the N332 glycan. See Figure 6—source data 1, Figure 6—source data 2and Figure 6—source data 3. See also Supplementary file 3 for fasta file of all chimeric and mutant VH and VL antibody chains used in Figures 4, 5, 6.

