. 2021 Jul 15;10:e68110. doi: 10.7554/eLife.68110

Figure 7. Mutational antigenic profiling of QA013.2 identifies unique viral escape mutations.

(A) Line plot showing the median positive differential selection across the mutagenized portion of BG505.W6.C2 T332N Env. (B) Logoplots showing the mutation-level enrichment for areas of escape in A. (C) Table of average fold change in IC50 for each BG505.W6.C2 T332N viral escape mutant relative to the wildtype BG505.W6.C2 T332N pseudovirus as tested in the TZM-bl neutralization assay. Darker red colors indicate a larger fold change in average IC50. In vitro neutralization data are representative of three independent replicates. (D) Heavy chain CDR3 loop is within 8 Å distance to the V1 loop when measured between the Cα chains. See also Figure 7—figure supplements 1 and 2 and Figure 7—source data 1.

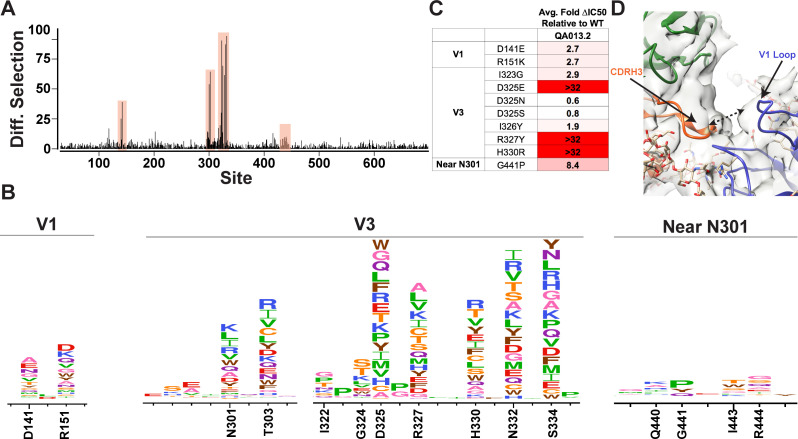
Figure 7—source data 1. Neutralization Source Data.

Figure 7.

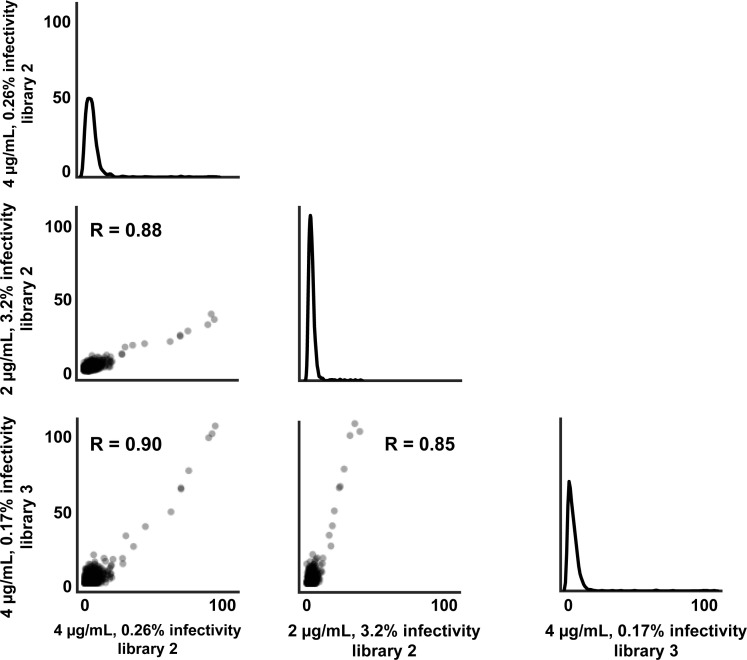
Figure 7—figure supplement 1. Correlation of positive site differential selection between mutational antigenic profiling replicates.

Figure 7—figure supplement 1.

For each replicate, the axes label the concentration of QA013.2 used, which mutant virus library was used, and the percent infectivity (based on qPCR).
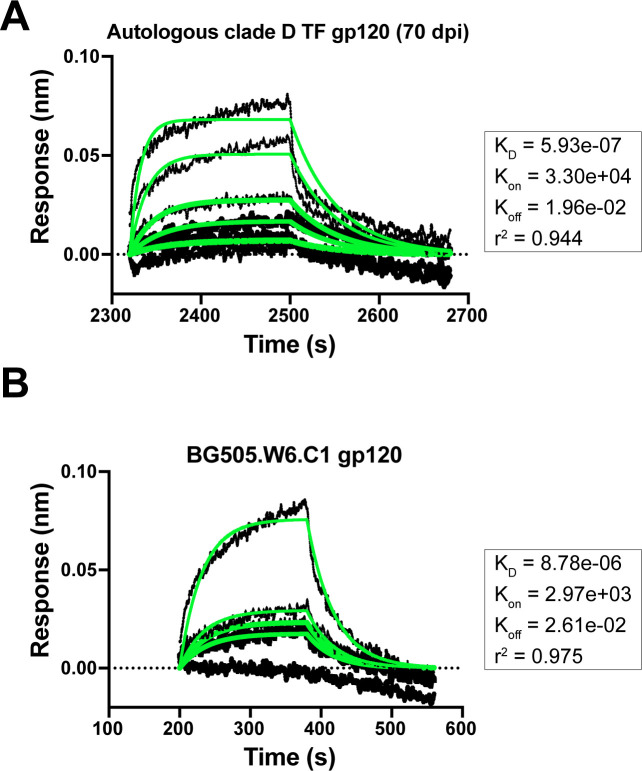
Figure 7—figure supplement 2. Mature bnAb QA013.2 binding to gp120 monomers that lack the N332 glycan.

Figure 7—figure supplement 2.

(A) Biolayer interferometry kinetic curve of mature bnAb QA013.2 (10 µg mL−1) bound to autologous clade D gp120 monomer from the initial virus (2 µM). (B) Biolayer interferometry kinetic curve of mature bnAb QA013.2 (10 µg mL−1) bound to BG505.W6.C1 gp120 monomer (2 µM). BLI curves were subjected to double reference background subtraction and data were fit to a global model of 1:1 ligand:analyte binding to obtain KD, kon, and kdis values. The resulting lines of best fit are shown in green. Dotted line across the graph marks 0.00 on the y-axis. Data are representative of two independent experiments.
Figure 7—figure supplement 2—source data 1. Biolayer Interferometry Source Data 1.
Figure 7—figure supplement 2—source data 2. Biolayer Interferometry Source Data 2.