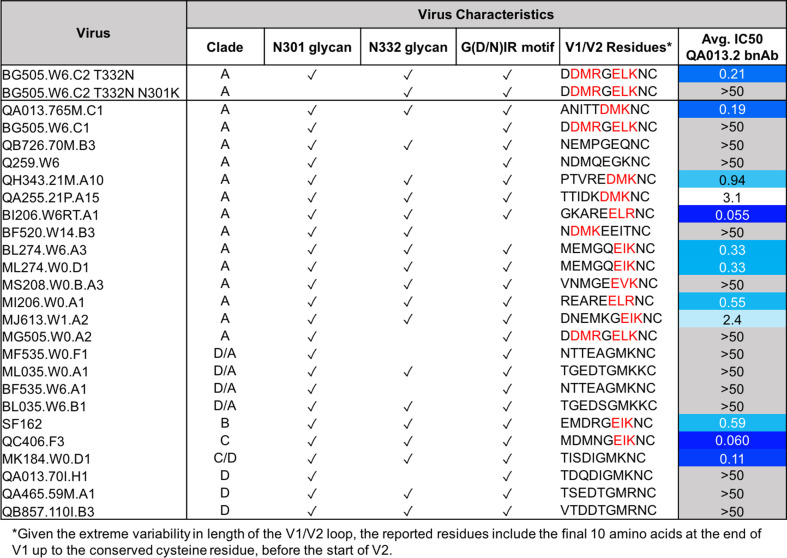
Figure 8. QA013.2 bnAb neutralization of a virus panel including a virus lacking the N301 glycan.
Tested pseudoviruses are shown with their respective clade in the left hand columns. Envelope characteristics are shown in the middle columns for each pseudovirus, including the presence (or absence) of glycans at N301 and N332 as well as the existence of the conserved G(D/N)IR linear motif at the base of the V3 loop as indicated by a check mark. The final ten residues in the V1 loop are shown for all pseudoviruses tested, in which residues that contain the [negative charge/branched hydrophobic/positive charge] motif are colored in red. The IC50 for each tested pseudovirus is shown in a column on the far right of the table. Darker blue indicates more potent neutralization, while white demonstrates weak neutralization, and grey represents no neutralization observed at the highest antibody concentration tested. Simian immunodeficiency virus (SIV) was used as a negative control; the tested bnAb showed no evidence of SIV neutralization (data not shown). IC50 values are the average of two independent replicates. See Figure 8—source data 1.

