. 2021 Jul 28;10:e66192. doi: 10.7554/eLife.66192

Figure 1. scRNA-seq of An. gambiae immune cells.

(A) Graphical overview of the isolation of mosquito immune cells from naive and blood-fed mosquitoes. Following perfusion, cells were stained to enable processing by fluorescent activated cell sorting (FACS) and isolation for scRNA-seq. Resulting immune cells data were separated into eight-cell clusters based on hierarchical clustering analysis (B) and visualized using a t-Distributed Stochastic Neighbor Embedding (t-SNE) plot (C). The number of expressed genes per cluster are displayed as a boxplot (D).

Figure 1.

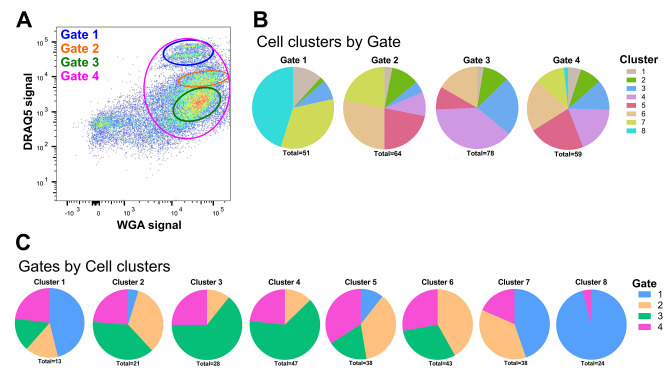
Figure 1—figure supplement 1. FACS sorting of mosquito immune cell populations.

Figure 1—figure supplement 1.

(A) Representative image of An. gambiae immune cell populations examined by flow cytometry. Distinct sub-populations of cells were separated into four gates: Gates 1–3 as unique populations based on WGA and DRAQ5 signal and Gate four to sample a mixed cell population. (B) The unique cell clusters identified in our RNA-seq analysis are visualized by the FACS gating from which they originated. (C) An additional breakdown of immune cell clusters by gate.
Figure 1—figure supplement 2. Quality assessment of scRNA-seq analysis on mosquito immune cells.

Figure 1—figure supplement 2.

The number of transcript reads per cell was used to determine the quality of single-cell data. Using a cutoff of 10,000 reads/cell, we removed 122 cells from our analysis, resulting in a total of 262 cells.
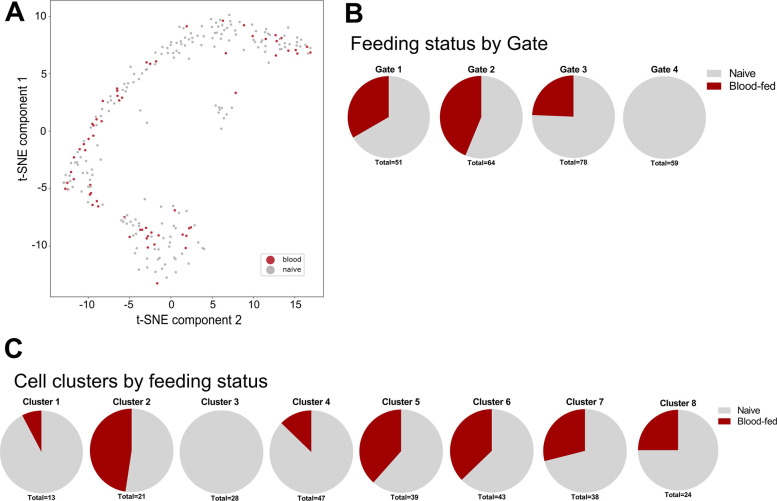
Figure 1—figure supplement 3. Naive and blood-fed immune cells isolated in FACS analysis.

Figure 1—figure supplement 3.

(A) Mosquito immune cells isolated from naive or blood-fed conditions visualized by t-SNE. (B) Cells from naive and blood-fed conditions were isolated in each of the FACS gatings, except for the presence of blood-fed samples in Gate 4 which were not included in our methodology. (C) An additional breakdown of immune cell clusters by feeding status reveals the presence of these immune cell populations under both naive and blood-fed conditions, with the exception of Cluster 3 that was only identified under naive conditions. In the isolation of cells blood-fed conditions, samples were not collected using the Gate 4 in our FACS gating methodology.
Figure 1—figure supplement 4. Examination of differentially regulated genes in Clusters 2 and 4 under naive and blood-fed conditions.

Figure 1—figure supplement 4.

Transcripts with significant differences in gene expression between naive and blood-fed conditions are displayed for Cluster 2 (A) and Cluster 4 (B). Black dots represent FKPM values obtained from individual cells within each cluster and physiological condition. Data are displayed as the mean +/- SEM.