. 2021 Jul 28;10:e66192. doi: 10.7554/eLife.66192

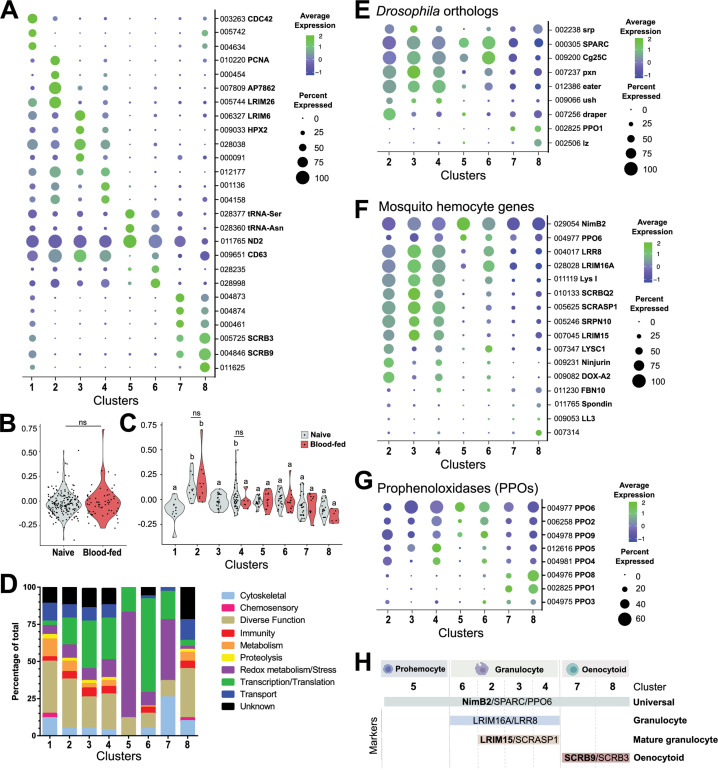
Figure 2. Comparative analysis of mosquito immune cells.

(A) Marker gene expression displayed by dot plot across cell clusters. Dot color shows levels of average expression, while dot size represents the percentage of cells expressing the corresponding genes in each cell cluster. (B) Violin plot of cell cycle genes (GO::0007049) displayed as the difference in average gene expression levels between the cell cycle gene set in cells under naïve and blood-fed conditions. (C) Similar comparisons of cell cycle genes were examined in individual cell clusters and under naïve and blood-fed conditions where possible. For B and C, positive numbers indicate higher levels of cell cycle gene expression compared to the random set for that physiological condition or cell cluster. (D) Gene ontology (GO) analysis of genes expressed in >80% cells within each respective cluster. Heat maps of candidate genes to Drosophila hemocyte orthologs (E), described mosquito hemocyte genes (F), or An. gambiae prophenoloxidases (PPOs) (G) to enable the characterization of immune cells form each cell cluster. (H) From these analysis, immune cells cluster were assigned to tentative cell types (prohemocytes, granulocytes, oenocytoids) based on the expression subtype-specific marker expression. Genes in bold are featured prominently in our downstream analysis.

Figure 2.

Figure 2—figure supplement 1. Comparisons of immune cell clusters to the An.

Figure 2—figure supplement 1.

gambiae phagocyte proteome. Transcripts expressed in >60% of cells of each immune cell cluster were compared to the 811 proteins identified in the naive phagocyte-enriched proteome previously published by Smith et al., 2016. Data are displayed as the percentage of genes identified in the proteome with corresponding transcripts from each respective immune cell cluster.
Figure 2—figure supplement 2. Comparisons of Cluster 1 to non-hemocyte cell populations.

Figure 2—figure supplement 2.

Mosquito hemolymph perfusions routinely have contaminants (fat body, etc.) in addition to hemocytes (A). Using enriched gene sets for fat body (B) or muscle cells (C) defined by Raddi et al., 2020, or non-hemocyte cell populations defined by Tattikota et al., 2020 (D), these data support that cells in Cluster 1 represent non-hemocyte contaminants in our analysis. (E) Bubble plots of Cluster 1 enriched markers (our study), fat body markers (Raddi et al., 2020), and non-hemocyte markers (Tattikota et al., 2020) across immune cell clusters identified in our study.
Figure 2—figure supplement 3. Expression of hemocyte genes across all cell clusters.

Figure 2—figure supplement 3.

Bubble plots display levels of average gene expression of hemocyte genes with previously described roles in Drosophila or Anopheles, with the dot size representing the percentage of cells expressing the corresponding genes in each cell cluster.
Figure 2—figure supplement 4. Expression of mosquito immune genes across cell clusters.

Figure 2—figure supplement 4.

Expression patterns of known components of the An. gambiae IMD, Toll, and JAK-STAT pathways, as well as other antimicrobial proteins (AMPs) and complement factors with integral roles in mosquito innate immunity displayed across immune cell clusters. Each row represents the normalized (averaged) gene expressed of a given transcript across clusters, with differences between cell clusters indicated by heatmaps displaying the fold change in normalized gene expression (Z-score). Patterns in gene expression are displayed by hierarchical clustering.
Figure 2—figure supplement 5. Expression of serine protease inhibitors (SRPNs) and CLIP serine proteases across cell clusters.

Figure 2—figure supplement 5.

Expression patterns of SRPN and CLIP family members across immune cell clusters. Each row represents the normalized (averaged) gene expressed of a given transcript across clusters, with differences between cell clusters indicated by heatmaps displaying the fold change in normalized gene expression (Z-score). Patterns in gene expression are displayed by hierarchical clustering.
Figure 2—figure supplement 6. Expression of chemosensory genes across cell clusters.

Figure 2—figure supplement 6.

Expression patterns of annotated ionotropic receptors (IRs) (A), gustatory receptors (GRs) (B), odorant receptors (ORs) (C), and odorant-binding proteins (OBPs) (D) across immune cell clusters. Each row represents the normalized (averaged) gene expressed of a given transcript across clusters, with differences between cell clusters indicated by heatmaps displaying the fold change in normalized gene expression (Z-score). Patterns in gene expression are displayed by hierarchical clustering.
Figure 2—figure supplement 7. Expression of specific tRNAs across cell clusters.

Figure 2—figure supplement 7.

Expression patterns of specific tRNAs across immune cell clusters. Each row represents the normalized (averaged) gene expressed of a given transcript across clusters, with differences between cell clusters indicated by heatmaps displaying the fold change in normalized gene expression (Z-score). Patterns in gene expression are displayed by hierarchical clustering.
Figure 2—figure supplement 8. Candidate markers of immune cell clusters and hemocyte sub-types.

Figure 2—figure supplement 8.

Summary of candidate marker genes for each immune cell cluster and putative hemocyte sub-type. Solid lines denote strong differential gene expression indicative of one or more clusters, while dashed lines display marker genes that are expressed in cell clusters at lower levels of expression. Gene accession numbers (without AGAP precursor) are shown on right with gene names.