. 2021 Jul 28;10:e66192. doi: 10.7554/eLife.66192

Figure 3. Definition of mosquito immune cell subtypes.

RNA-FISH and gene expression profiles across cell clusters for the ‘universal’ marker, NimB2 (A), the ‘granulocyte’ marker, LRIM15 (B), and ‘oenocytoid’ marker, SCRB9 (C). The percentage of adherent cells following fixation was evaluated for each of the respective NimB2, LRIM15, and SCRB9 markers in four or more independent replicates (D). To determine the phagocytic ability of granulocytes and oenocytoids, the uptake of fluorescent beads was evaluated in either LRIM15+ or SCRB9+ cells in two independent replicates (E). LRIM15+ cells display a higher phagocytic index (# beads engulfed per cell) than LRIM15- cell populations (F). Data were analyzed using a Mann–Whitney test, with bars representing mean ± SE of two independent replicates. The phagocytic ability of LRIM15+ cells was further validated by examining the abundance of NimB2+/LRIM15+ cells by RNA-FISH following perfusion after treatment with control (LP)- or clodronate (CLD) liposomes that deplete phagocytic cells (G). Data were analyzed using a Mann–Whitney test. Bars represent mean ± SE of two independent replicates. Additional validation of clodronate (CLD) depletion of phagocytic cells was performed by qRT-PCR using primers for universal (uni.), granulocyte (gran.), and oenocytoid (oeno.) cell markers. Data were analyzed using an unpaired t test to determine differences in relative gene expression between LP and CLD treatments. Bars represent mean ± SE of three independent replications (H). Asterisks denote significance (**p < 0.01, ***p < 0.001). Scale bar, 10 µm.

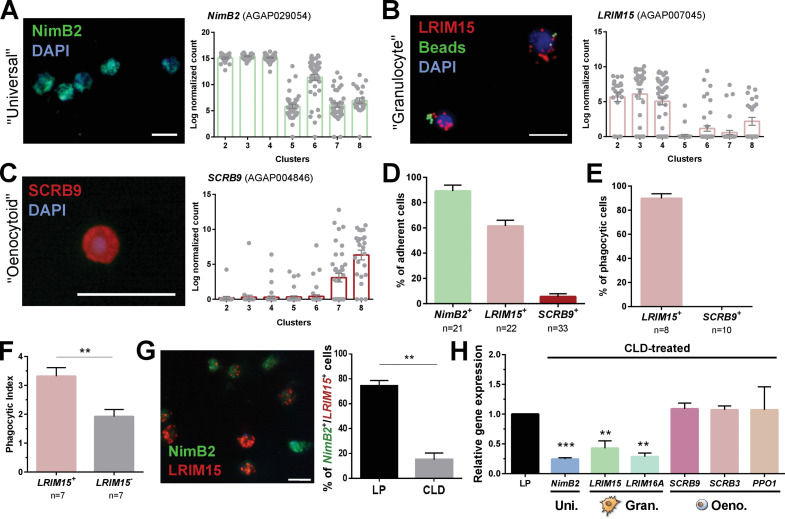
Figure 3—source data 1. Source data pertaining to data presented in Figure 3D–H.

Figure 3.

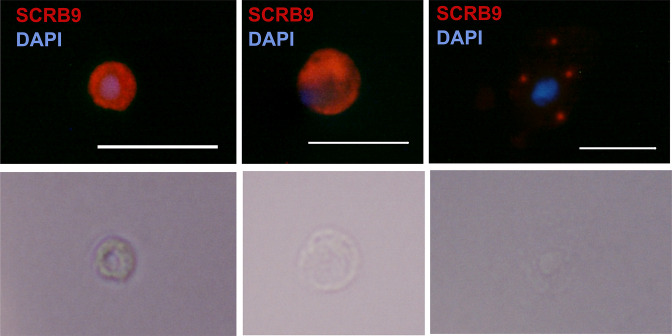
Figure 3—figure supplement 1. RNA-FISH of SCRB9+ immune cells.

Figure 3—figure supplement 1.

RNA-FISH images of immune cells labeled with SCRB9 and stained with DAPI. Below is the corresponding phase contrast image of the same fixed cell. Scale bar, 10 µm.
Figure 3—figure supplement 2. Expression profile and RNA-FISH of SCRB3+ immune cells.

Figure 3—figure supplement 2.

(A) Expression of SCRB3 across immune cell clusters. (B) RNA-FISH images of immune cells labeled with SCRB3 and stained with DAPI. Below is the corresponding phase contrast image of the same fixed cell. Scale bar, 10 µm.
Figure 3—figure supplement 3. Co-hybridization of SCRB9 and LRIM15 labels distinct immune cell populations by RNA-FISH.

Figure 3—figure supplement 3.

RNA-FISH experiments were performed with both SCRB9 and LRIM15 probes, with the resulting percentage of cells expressing either, both, or neither immune cell marker. n, number of individual mosquitoes examined.
Figure 3—figure supplement 4. Expression of granulocyte and oenocytoid markers to distinguish immune cell sub-types.

Figure 3—figure supplement 4.

Expression of marker genes to distinguish granulocyte (A) or oenocytoid (B) immune cell sub-types. Cluster 5 is included as an outgroup to help distinguish gene expression differences between Clusters 7 and 8 in (B). Each row represents the normalized (averaged) gene expressed of a given transcript across clusters, with differences between cell clusters indicated by heatmaps displaying the fold change in normalized gene expression (Z-score). Patterns in gene expression are displayed by hierarchical clustering.
Figure 3—figure supplement 5. Examination of conserved hemocyte markers across Anopheles and Drosophila single-cell studies.

Figure 3—figure supplement 5.

Hemocyte markers defined by functional studies in Drosophila that correspond to ‘universal’, ‘granulocyte/plasmatocyte’, and ‘oenocytoid/ crystal cell’ lineages were compared across recent studies in Anopheles (this study, Raddi et al., 2020) and Drosophila (Tattikota et al., 2020). For each gene, the corresponding mosquito and fly accession numbers are provided, with heatmaps of their expression patterns visualized on tSNE plots from each respective study. For both the granulocyte/plasmatocyte and oenocytoid/crystal cell lineages, corresponding cell types are outlined as defined in each study.
Figure 3—figure supplement 6. Examination of mosquito hemocyte markers in Anopheles single-cell studies.

Figure 3—figure supplement 6.

Previously described mosquito-specific hemocyte markers were examined in recent single-cell studies in Anopheles (this study, Raddi et al., 2020) in prohemocyte/granulocyte populations (A) and in oenocytoids (B). For each gene, the corresponding mosquito accession numbers are provided, with heatmaps of their expression patterns visualized on tSNE plots from each respective study. Comparable cell populations are outlined as defined by each study. While markers are in general agreement in (A), the expression of markers to define oenocytoids (B) significantly differ between the two studies.
Figure 3—figure supplement 7. Comparison of immune cell clusters to Raddi et al.

Figure 3—figure supplement 7.

Markers used to define immune cell subtypes (HC1-6) in Raddi et al., 2020 were displayed as bubble plots across immune cell clusters identified in our study (A). Using previously described gene sets for HC1-6 (Raddi et al., 2020), the hemocyte cell clusters identified in our analysis (2-8) were compared to determine the percentage of genes expressed within that cluster (B). Highlighted cell clusters (colors) denote the most likely ortholog(s) between studies.
Figure 3—figure supplement 8. Comparisons of immune cell clusters to previously defined PPO6low and PPO6high hemocyte populations.

Figure 3—figure supplement 8.

To correlate the immune cell clusters identified in our analysis with previously described PPO6low and PPO6high hemocyte populations (Severo et al., 2018), we examined the expression of LysI (A) and FBN10 (B) as respective markers of these previously defined cell populations. Although the expression of LysI and FBN10 was distributed across multiple cell clusters in our analysis, transcripts displayed strong negative or positive correlations respectively to the expression of PPO6 (C).