Figure 5. Lozenge promotes oenocytoid differentiation.
RNA-FISH and gene expression profiles across cell clusters for lozenge (Lz) (A). Scale bar, 10 µm. The percentage of adherent Lz+/NimB2+ or Lz-/NimB2+ cells were examined in naïve adult female mosquitoes to estimate cell abundance (B). Data were collected from two independent experiments. Asterisks denote significance (****p< 0.0001). To more closely examine the population of Lz+ cells, RNA-FISH experiments were performed double staining for Lz and the oenocytoid marker, SCRB9 (C). The percentage of fixed cells positive for one, both, or neither marker is displayed with representative images. Data are summarized from two independent experiments. To determine the effects of Lz on immune cell populations, the abundance of LRIM15+/SCRB9- (granulocyte) and LRIM15-/SCRB9+ (oenocytoid) cells were evaluated by RNA-FISH after GFP (control)- or Lz-silencing (D). Data represent the mean ± SE of three independent replicates. Significance was determined using Mann-Whitney analysis and is denoted by an asterisk (*p < 0.05); ns, not significant. Since Lz expression has previously been associated with prophenoloxidase (PPO) expression, the expression of all eight genes identified in our scRNA-seq analysis were examined by qRT-PCR in GFP (control) - Lz-silenced mosquitoes (E). Data represent the mean ± SE of three or more independent replicates and were analyzed by a one-way ANOVA and Holm-Sidak’s multiple comparison test using GraphPad Prism 6.0. Asterisks denote significance (***p < 0.001). (F) Summary of Lz-silencing experiments which display a reduction in oenocytoid numbers and a specific sub-set of PPO gene expression which support that Lz is integral to the differentiation of the mosquito oenocytoid lineage.
Figure 5—figure supplement 1. Phagocytic properties of a subset of lozenge (lz)+ cells.
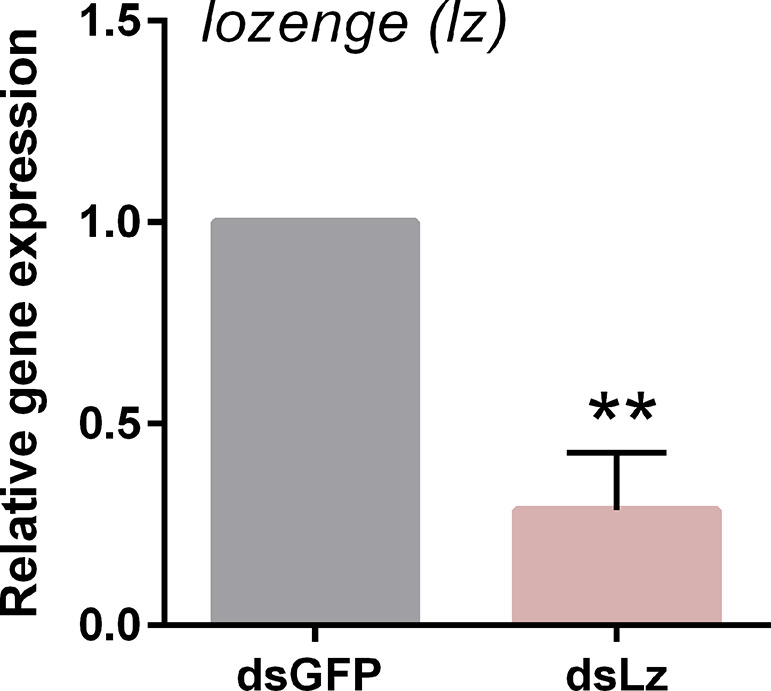
Figure 5—figure supplement 2. Validation of lozenge knockdown following RNAi.


