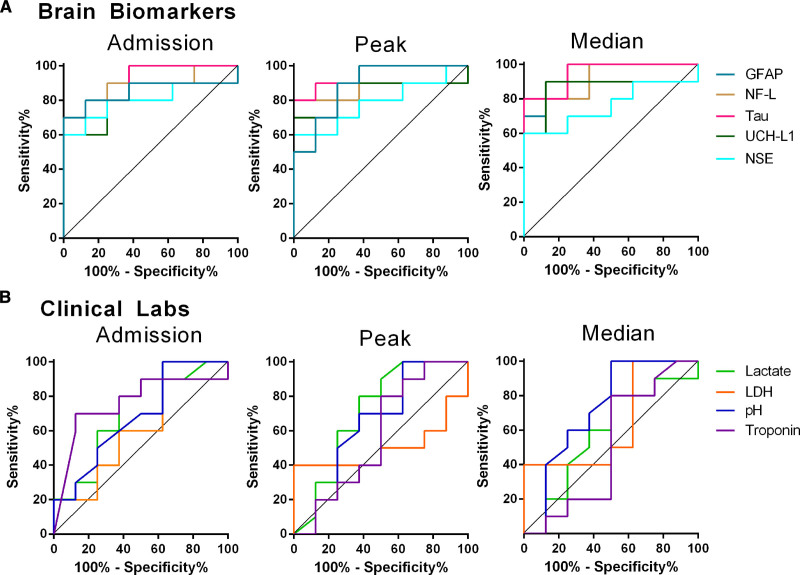
Figure 3.
Standard clinical laboratory values in cardiac arrest patients with brain normoxia and hypoxia. Receiver operator curve characteristic analyses for admission, peak, and median brain biomarkers (A) and standard clinical laboratories (B) are depicted. All brain biomarkers were able to differentiate between brain normoxia and hypoxia with statistical significance (P<0.05 for all), while no clinical laboratory results were able to differentiate between brain normoxia and hypoxia. Specific data outputs for ROC analyses are in Table IV in the Data Supplement. GFAP indicates glial fibrillary acidic protein; LDH, lactate dehydrogenase; NF-L, neurofilament light chain; NSE, neuron-specific enolase; and UCH-L1, ubiquitin carboxy-terminal hydrolase L1.

