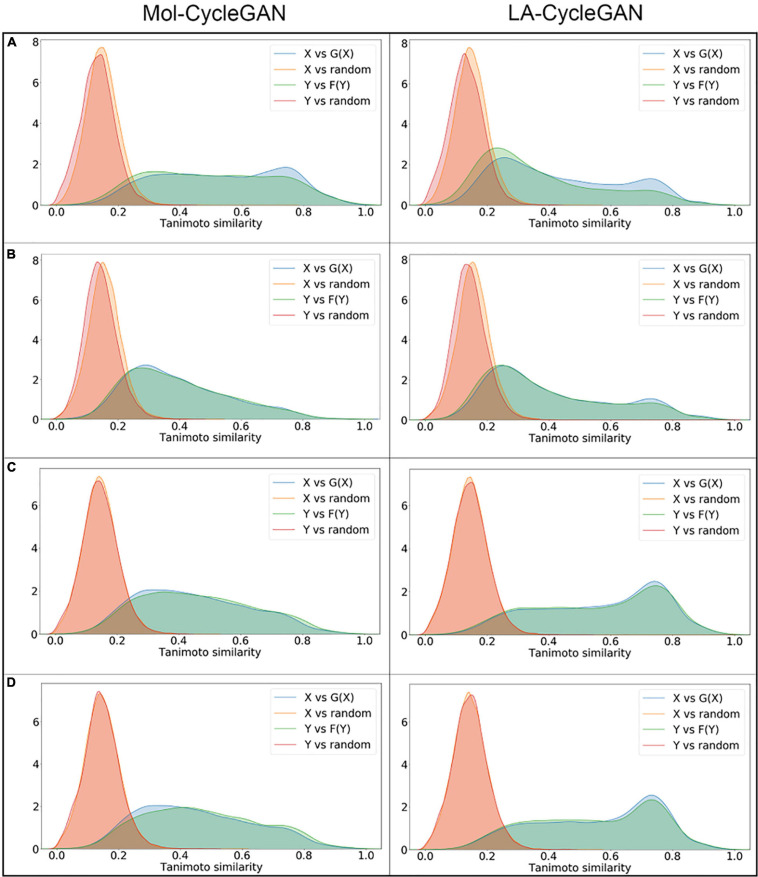
FIGURE 5.
Density map of Tanimoto similarity between corresponding molecules. (A) Tanimoto similarity for the Aliphatic Rings subset; (B) Tanimoto similarity for the Aromatic Rings subset; (C) Tanimoto similarity for the HBA subset; (D) Tanimoto similarity for the HBD subset. The left panel is from Mol-CycleGAN and the right panel is from LA-CycleGAN.

