
Figure 3.
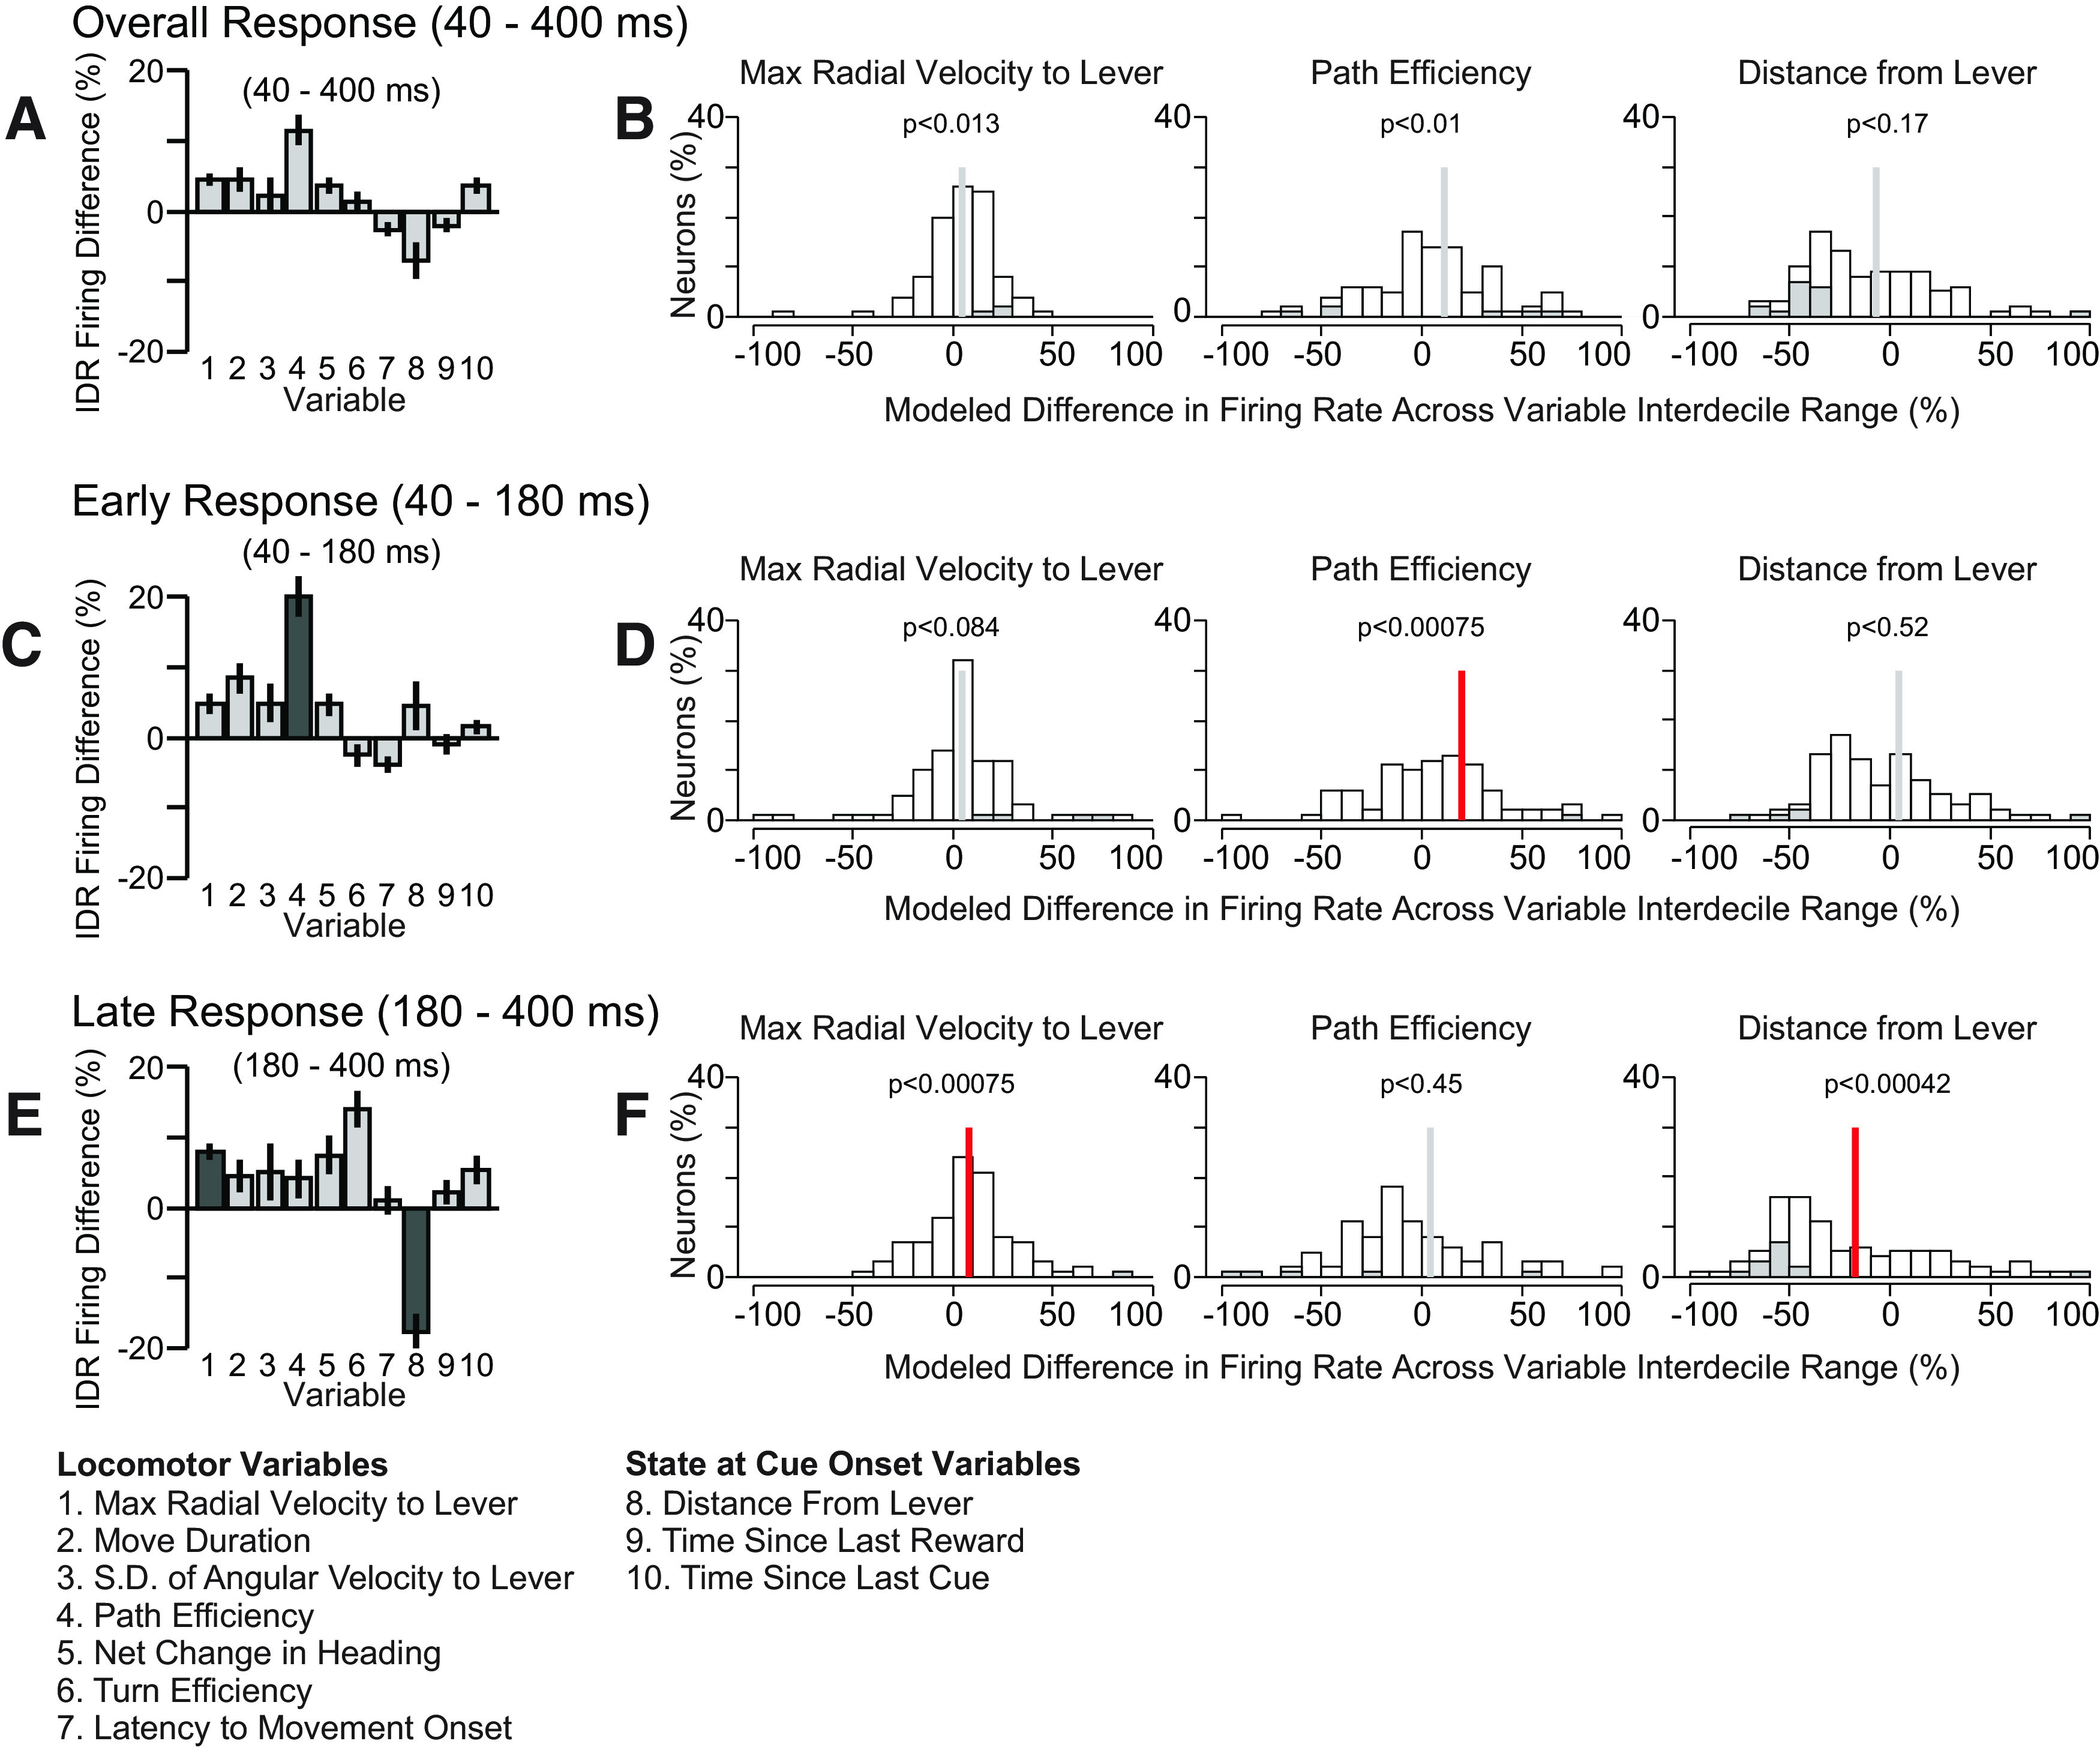
Cue-evoked firing of VP neurons was correlated with movement speed toward the lever and with lever proximity at cue onset. Analysis results from the larger (10-variable) GLM are shown. A, Each bar indicates mean and SE of normalized regression estimates (IDR Firing Difference, the percent change in firing response across the IDR of the variable) for 165 cue-excited neurons in the overall firing response window (40–400 ms after DS onset). Dark shaded bars indicate significantly correlated regressors. B, Individual distributions of three regressors across cue-excited neurons. Gray bars indicate individually significant coefficients. C, E, Same as A but for the early and late response windows, respectively. D, F, Same as B but for the early and late response windows, respectively. In B, D, F, the vertical bar indicates the mean, and the color of the bar indicates whether the mean is significantly different from 0 (red, p < 0.05, one sample t test with Holm’s modified Bonferroni correction).