Figure 6.

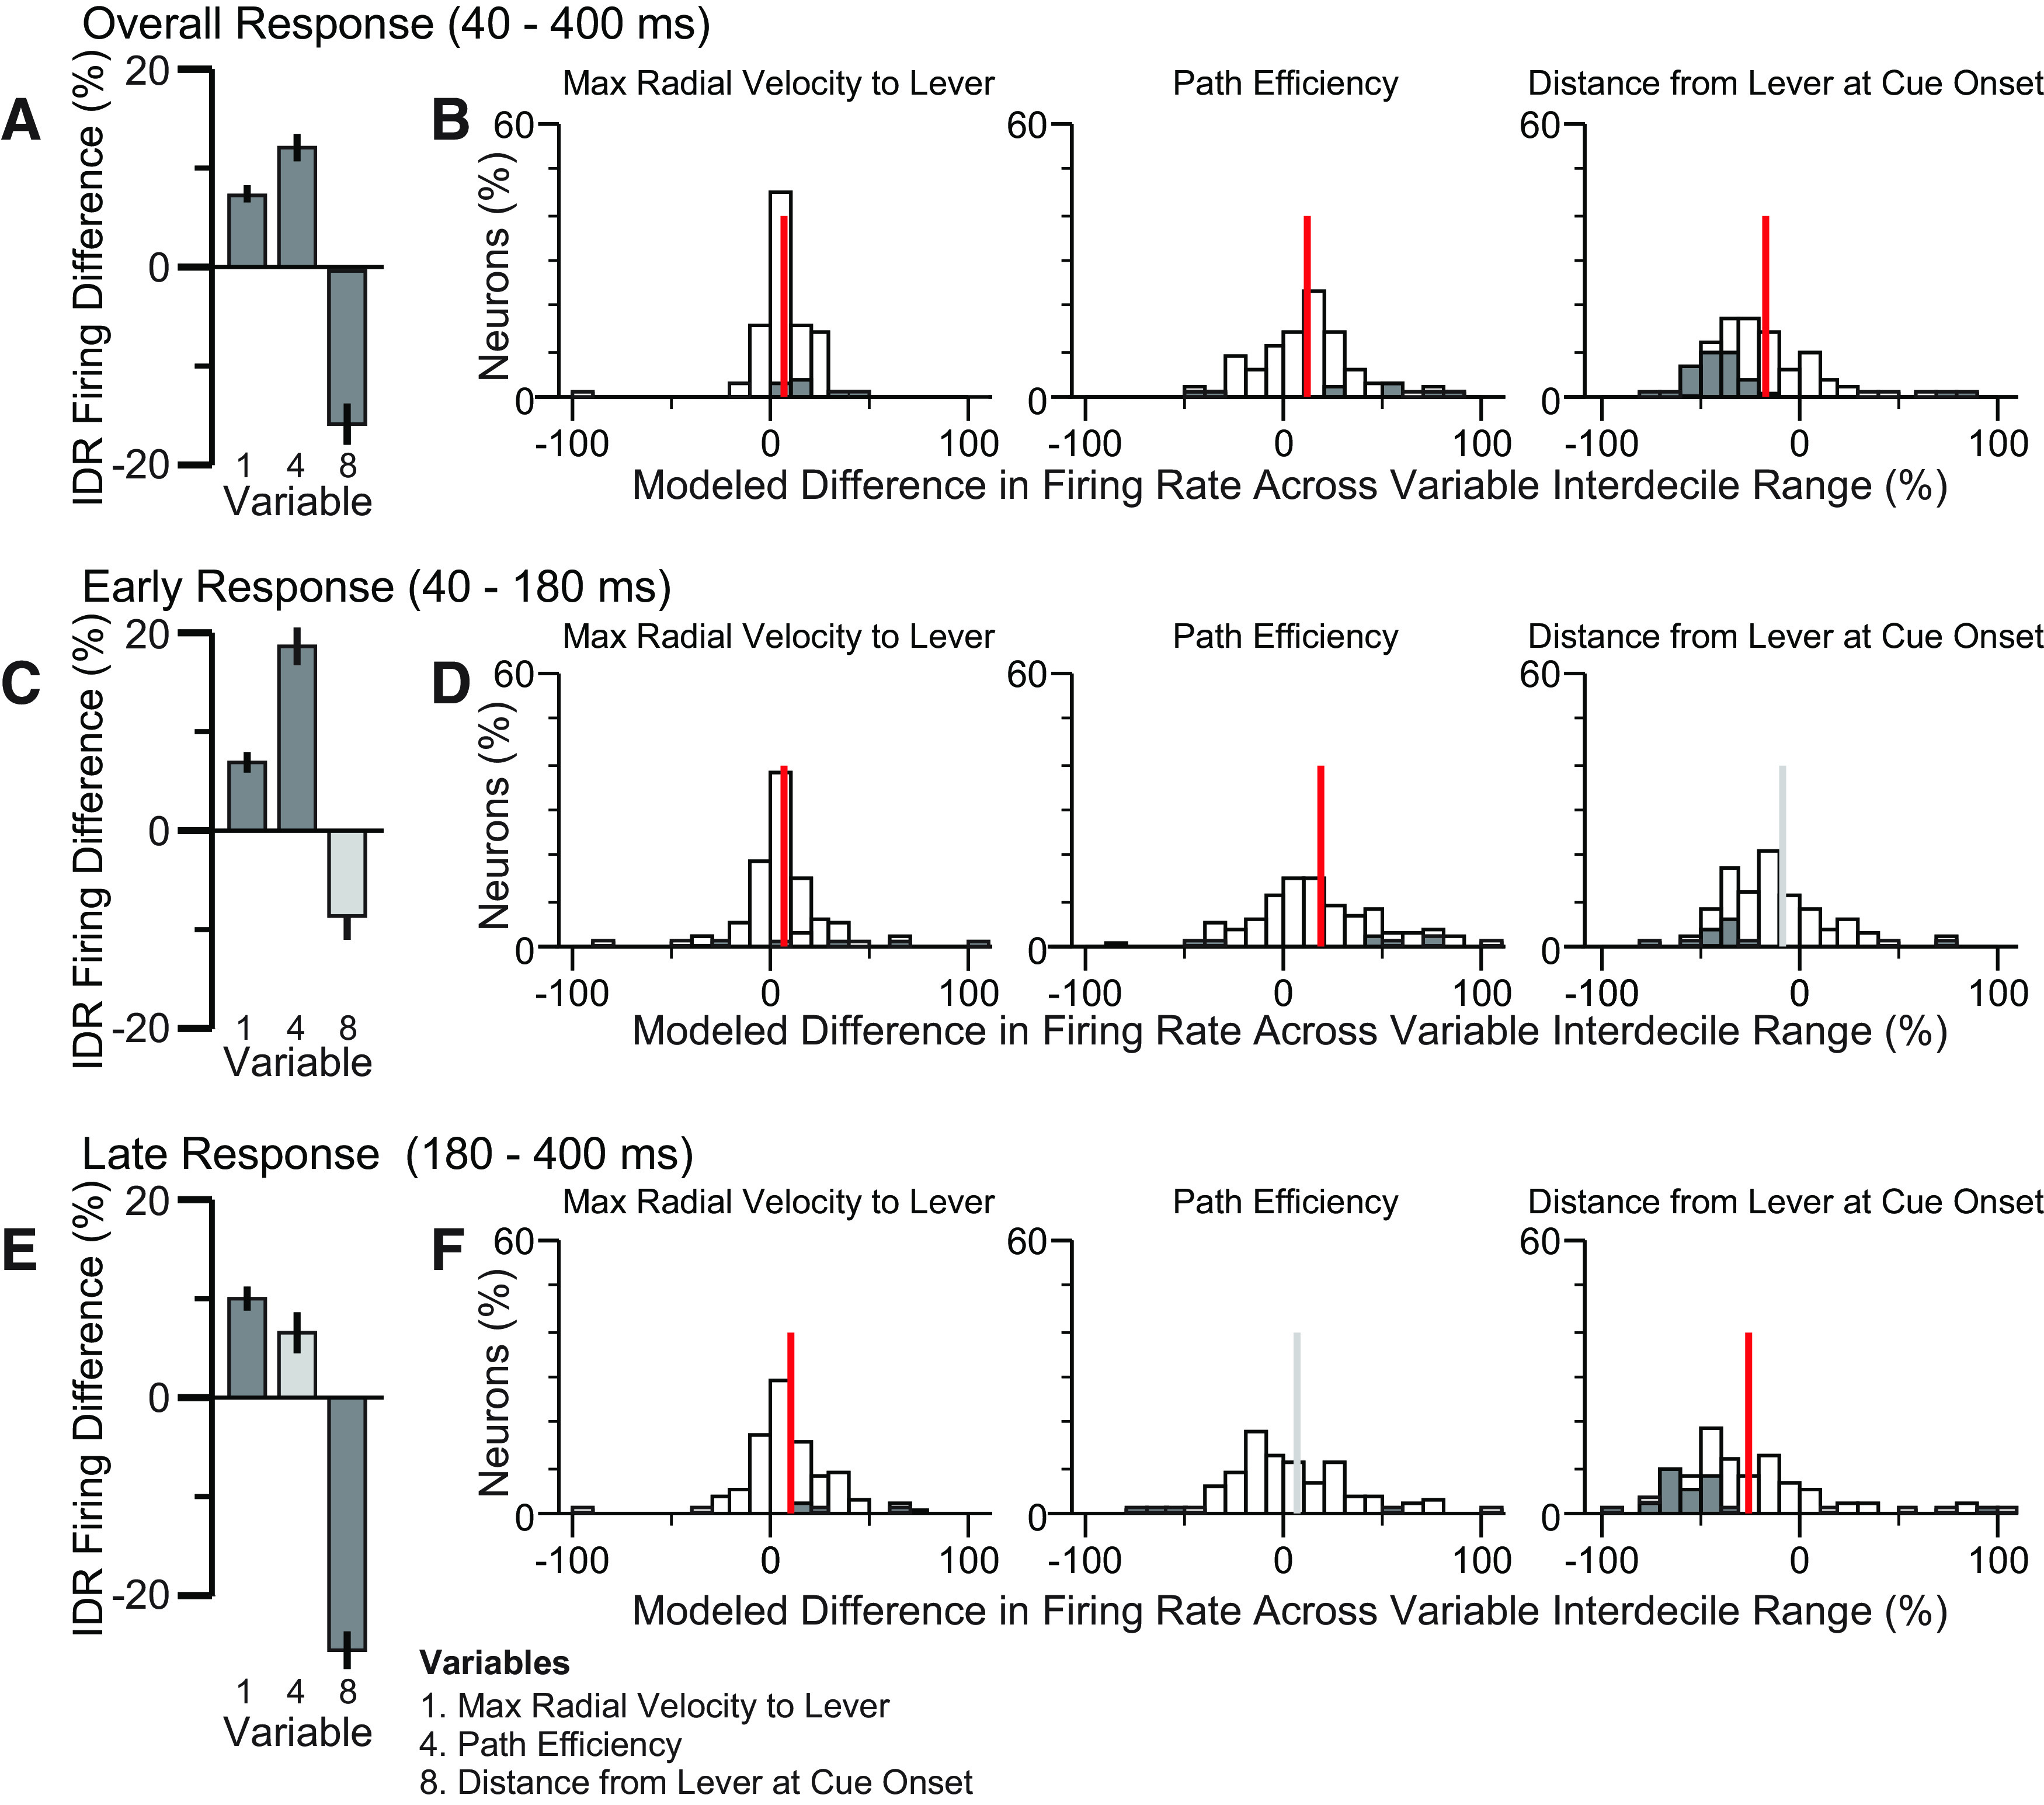
Focused GLM. Analysis results from the focused (three-variable) GLM are shown. Figure panels are as described for Figure 3.

Focused GLM. Analysis results from the focused (three-variable) GLM are shown. Figure panels are as described for Figure 3.