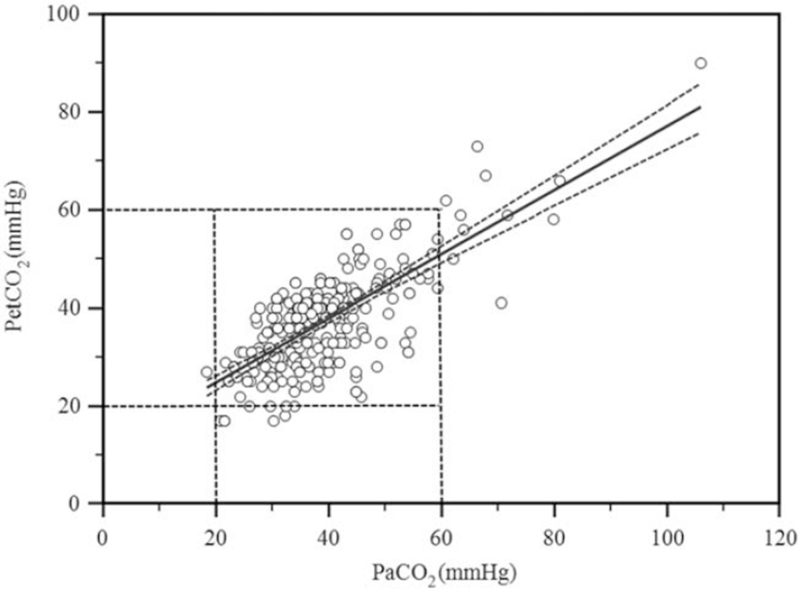
Figure 1.
Scatter diagram between PETCO2 and PaCO2 for all patients. The correlation coefficient was 0.72; the linear regression equation Y = 11.81 + 0.65x (Y: PETCO2; x: PaCO2). The solid blue line is the regression line; the blue dashed line is the 95% confidence interval. The majority of PETO2 and PaCO2 values are distributed in 20 to 60 mm Hg (black dotted frame). PaCO2 = arterial carbon dioxide tension, PETCO2 = end-expiratory carbon dioxide partial pressure.

