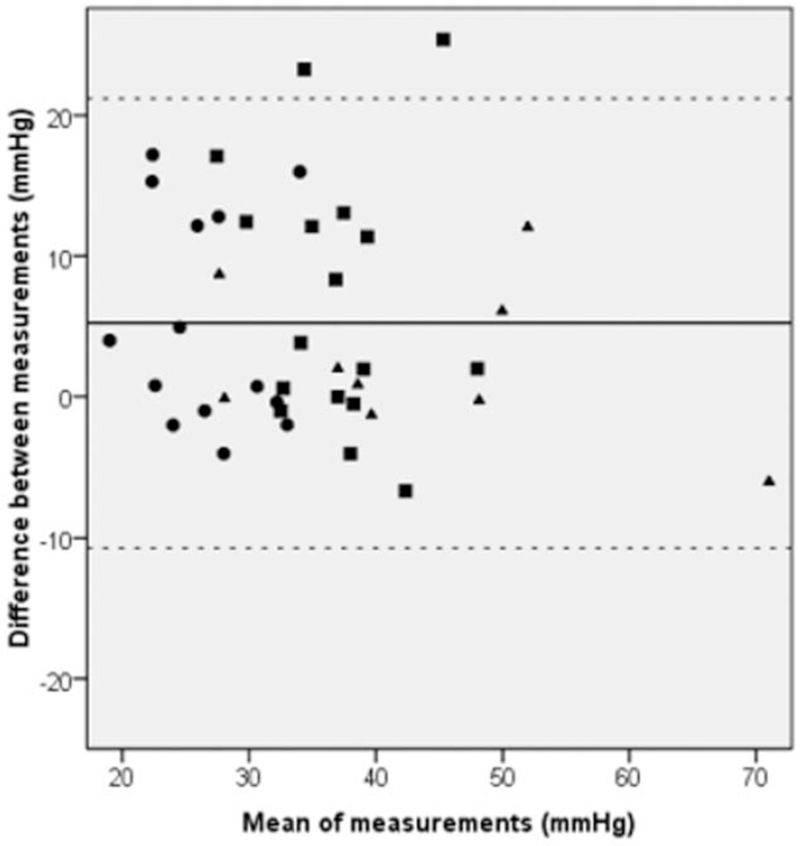
Figure 1.
Bland-Altman plot of agreement between right ventricular systolic pressure (RVSP) and systolic pulmonary artery pressure (sysPAP) for the 3 subgroups. Each symbol represents 1 measurement. Dots represent patients with mild to moderate tricuspid regurgitation (TR) and mean pulmonary artery pressure (meanPAP) <25 mm Hg, squares represent patients with mild to moderate TR and meanPAP ≥25 mm Hg, triangles represent patients with severe TR. Solid line marks bias, dotted lines mark limits of agreement.

