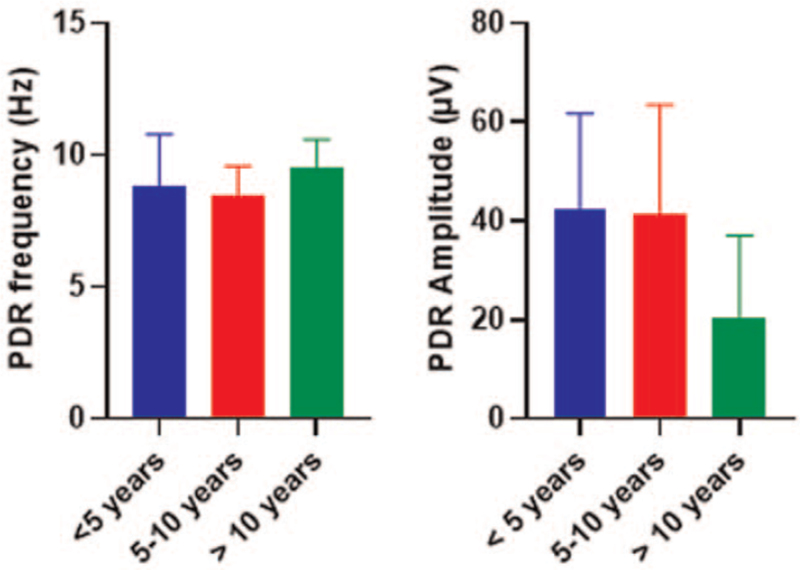
Figure 4.
Comparison of PDR wave frequencies and amplitudes distribution among different groups of MS patients according to the disease duration. Data shown are mean value ± SD comparison between groups was completed using one-way analysis of variance test. MS = multiple sclerosis, PDR = posterior dominant rhythm, SD = standard deviation.

