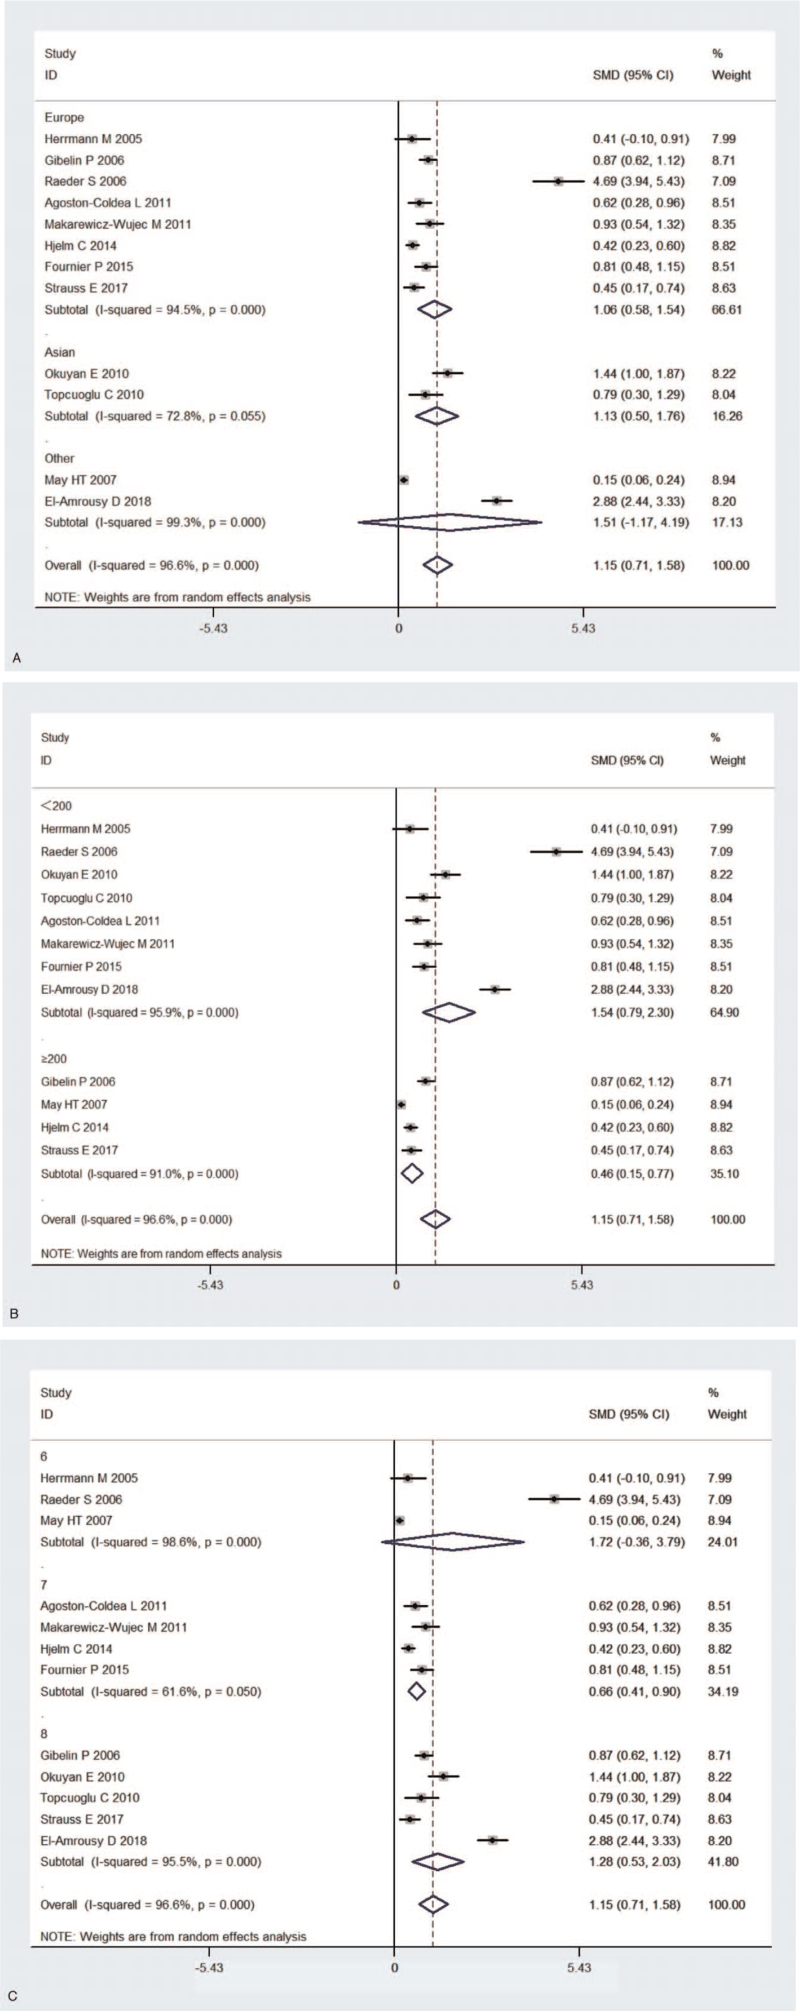
Figure 4.
(A) Subgroup analysis of studies in levels of homocysteine for subjects with HF vs control subjects. Stratified by geographical location (A). Stratified by subgroups of sample size (B). Stratified by NOS scores (C). (B) Subgroup analysis of studies in levels of homocysteine for subjects with HF vs control subjects. Stratified by geographical location (A). Stratified by subgroups of sample size (B). Stratified by NOS scores (C). (C) Subgroup analysis of studies in levels of homocysteine for subjects with HF vs control subjects. Stratified by geographical location (A). Stratified by subgroups of sample size (B). Stratified by NOS scores (C). HF = heart failure, NOS = Newcastle–Ottawa Scale.

