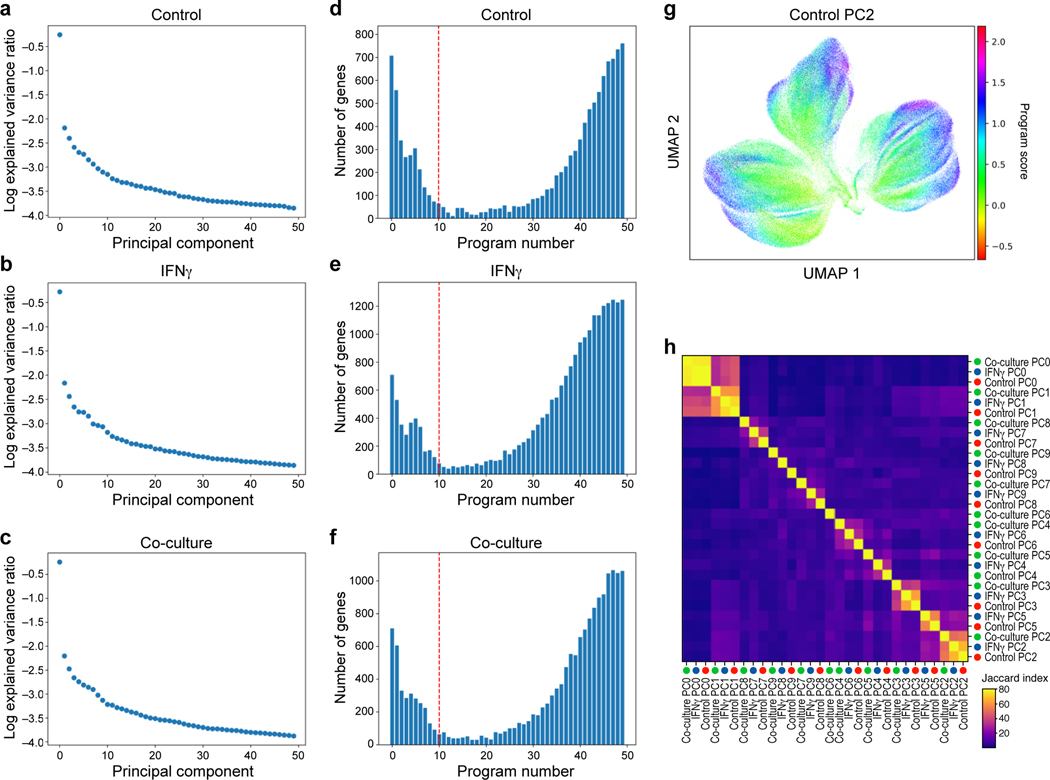
Extended Data Fig. 5. Learning expression programs in different conditions.
a-f, Identification of programs by jackstraw PCA in each condition. a-c. Explained variance (y axis) by each principal component (x axis) for PCA performed on control (a), IFNγ-treated (b), or co-culture (c) Perturb-CITE-seq data. d-f, Number of features (y axis) for each jackstraw program (x axis) for models learned on control (a), IFNγ-treated (b), or co-culture (c) Perturb-CITE-seq data. Dotted red line: cutoff for programs considered in further analysis. g, G2M program learned from control dataset. UMAP embedding of cells (dots) by scRNA-seq profiles, with cells colored by the gene set score (color bar) (Methods) of a G2M cell cycle control program (compare to Fig. 3f) (Methods). h, Identifying related programs across conditions. Jaccard index (color bar) for each pair of programs across all 30 programs (rows).

