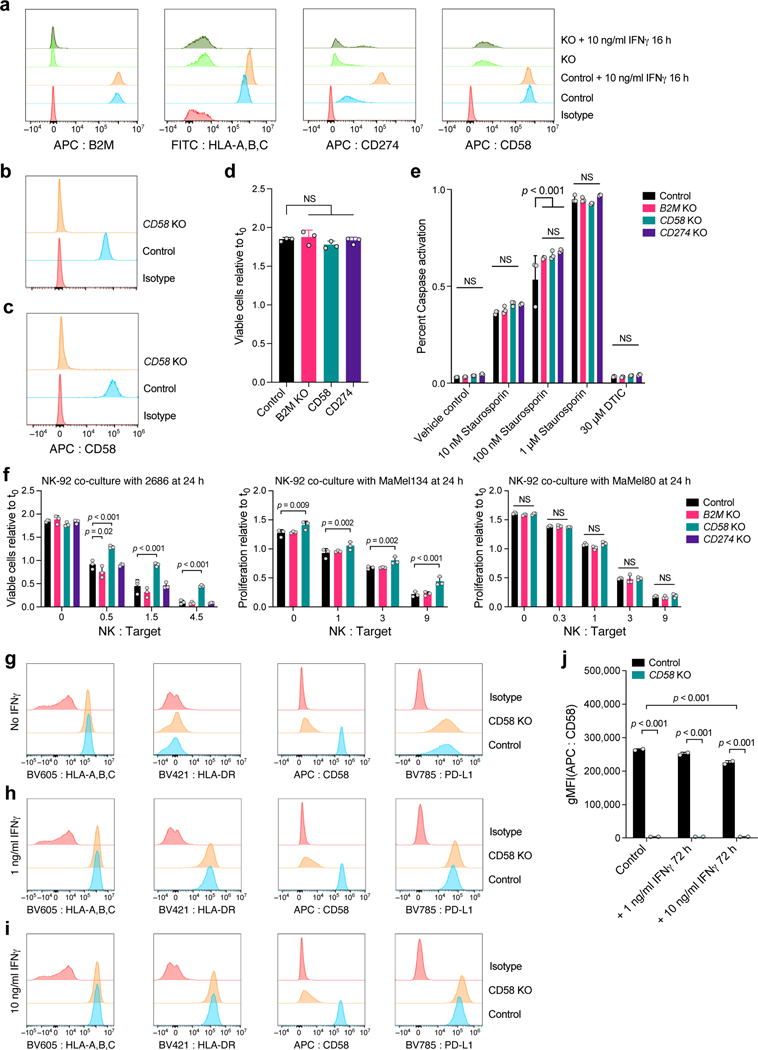
Extended Data Fig. 7. Role of CD58 in resistance to T cell mediated killing and regulation of PD-L1.
a, Validation of CRISPR/Cas9 KO (and unperturbed control) melanoma cells. a, Distribution of fluorescent intensity of CD58 (APC-CD58), B2M (APC-B2M), MHC-I (FITC-HLA-A,B,C), PD-L1 (APC-CD274) or staining with isotype control, without or with IFNg stimulation, in 2686 melanoma cells. b, Validation of CD58 KO MaMel-134, and c, MaMel-80 melanoma cells. d, Comparable growth of control and KO cells. Ratio of viable cells relative to timepoint 0 (y axis) for control and B2M KO, CD58 KO or CD274 KO melanoma cells from patient 2686 (x axis). e, Comparable induction of apoptosis in response to Staurosporin and resistance to DTIC in control and KO melanoma cells. Percent of cells inducing Caspase 3/7 (y axis) in control and B2M KO, CD58 KO or CD274 KO melanoma cells (color code) from patient 2686 in different treatment conditions (x axis). f, Co-culture experiments of three melanoma cells lines (2686, MaMel134 and MaMel80) at increasing ratios of NK cells and tumor cells with different genotypes (including CD58 KO, B2M KO in all models, and additionally CD274 KO in 2686). g-j, CD58 perturbation in co-culture does not affect B2M and HLA expression at the RNA and protein level but induces CD274. Distribution of fluorescent intensity by flow cytometry (corresponding to Fig. 5i-k) of MHC Class I and II, CD58, and PD-L1 in parental (control) and CD58 KO lines at baseline (g) and after 72 hours of stimulation with either 1 ng IFNγ (h) or 10 ng IFNγ (i), and summary of the impact of IFNγ on CD58 protein abundance after 72 hours. In all experiments, we used a one-way ANOVA with Tukey post hoc test. Error bars: Mean ±SD. All experiments were performed in triplicates in each of at least two independent experiments.

