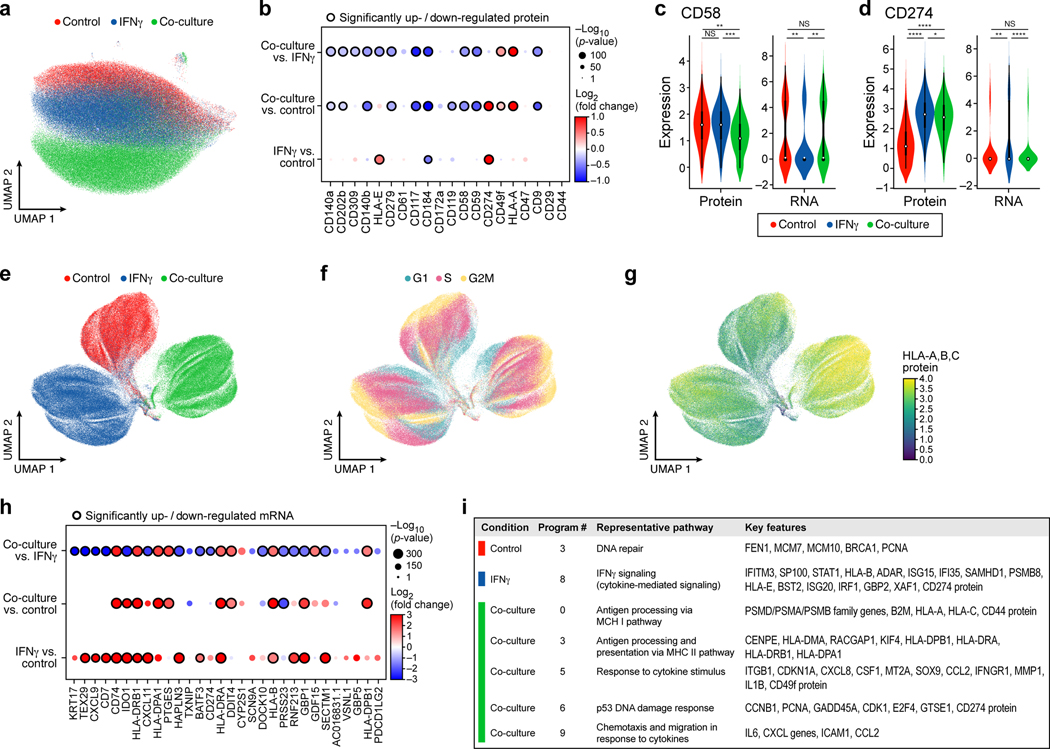
Figure 3. Single-cell protein and RNA profiles reveal regulation of genes and program involved in immune evasion.
a,b. Distinct protein profiles across immune pressures highlight regulation of cell surface proteins whose genetic perturbation confers resistance to TIL mediated killing. a. Uniform Manifold Approximation and Projection (UMAP) embedding of single cell CITE-antibody count profiles (dots) colored by condition (color legend). b. Log2(Fold Change) (dot color) and significance (-log10(p-value)), dot size (and statistically significantly up/downregulated circled with black border), logistic regression model; Methods) between each pair of conditions (rows) of each cell surface protein (columns) measured by CITE-Seq. c,d. Regulation of CD58 and CD274 (PDL1) by culture conditions. Distribution of protein counts (y axis, left) or RNA (normalized expression, Methods) (y axis, right) for CD58 (c) and CD274 (d). **** P < 1−10, Welch’s t test. Middle dot: median; box edges: 25th and 75th percentiles; whiskers: most extreme points that do not exceed ± 1.5 times interquartile range (IQR). Shading denotes a kernel density estimate with a bandwidth of 0.4. e-g. Variation in RNA profiles across and within conditions captures cell cycle state and MHC-I protein expression. UMAP embedding of scRNA-seq profiles (dots) colored by condition (e), cell cycle phase signature (f), or MHC (HLA-A,B,C) expression level (g, color bar). h,i. RNA expression of key immune genes and programs is impacted by increased immune pressure. h. Log2(Fold Change) (dot color) and significance (-log10(p-value)), dot size (and statistically significantly up/downregulated circled with black border)31 between each pair of conditions (rows) of the RNA of select immune genes (columns) measured by scRNA-seq, and differentially expressed between conditions. i. Gene programs identified by jackstraw PCA in each condition, representative enriched Gene Ontology processes, and select member genes.

