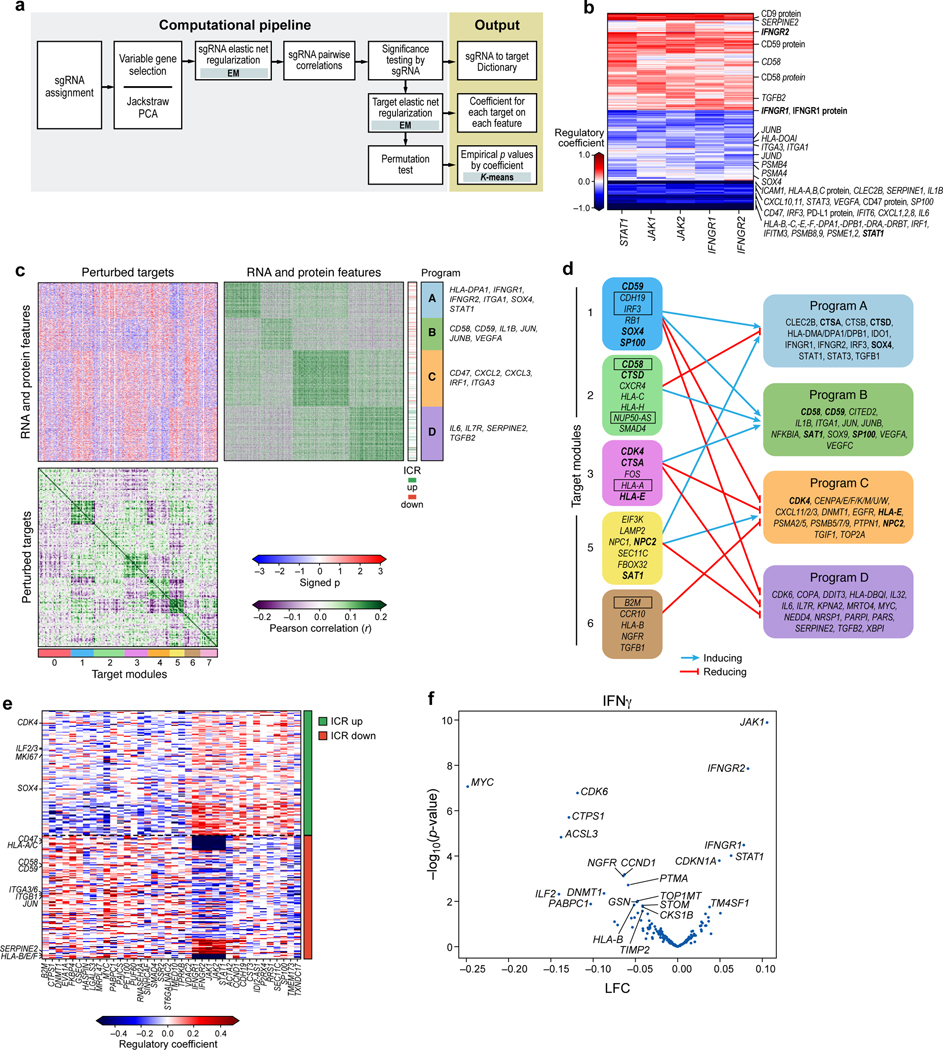
Figure 4. Perturb-CITE-Seq reveals co-functional modules that are dependent- or independent of a predominant IFNg/JAK-STAT mechanism.
a. Overview of computational approach (Methods). b. Perturbations in JAK/STAT pathway affect known and putative mechanisms of immune evasion. Regulatory effect ( values) on RNA and protein features (rows) when perturbing different genes in the JAK-STAT pathway (columns). c,d. Co-functional modules and co-regulated programs in the Perturb-CITE-Seq screen. c. Middle heatmap: Signed significance (−log10(Empirical p) * sign(²), red/blue color bar) for the effect on each RNA/protein feature (rows) of perturbing each gene (columns, excluding JAK-STAT targets) in the co-culture condition. Right and bottom matrices: Pearson correlation coefficient (purple/green color bar) between the significance profiles of either gene/protein features (right matrix) or perturbed genes (bottom matrix). Co-functional modules (bottom bar) and co-regulated programs (right bar) are identified by K-means clustering of each of the bottom and right matrices separately (k=4 and 8, respectively), and the clustering defines the row and column order. d. Representation of the regulatory connections between select modules (left) and programs (right) from c. Bold font: select regulators that are also members of programs. Boxed font: selected regulators significantly enriched/depleted in the viability screen (Fig. 2d,e). Notably, the edges in d are opposite the sign of the empirical p value in c: a target module connected to a co-regulated program with negative signed p values in c activates the corresponding program in d. e,f. The ICR program is coherently regulated by the perturbed regulators. e. Regulatory effect ( values) on RNA/protein features from the ICR program (rows, ICR as defined in Ref. 9) by perturbations of different genes in the screen (columns), clustered by K-means clustering (K=2). f. Change in ICR signature scores and its associated significance (y axis, -log10(P-value), Welch’s t test) for each perturbation (dot) in the IFN condition (Methods). Key perturbations with significant effects are noted.

