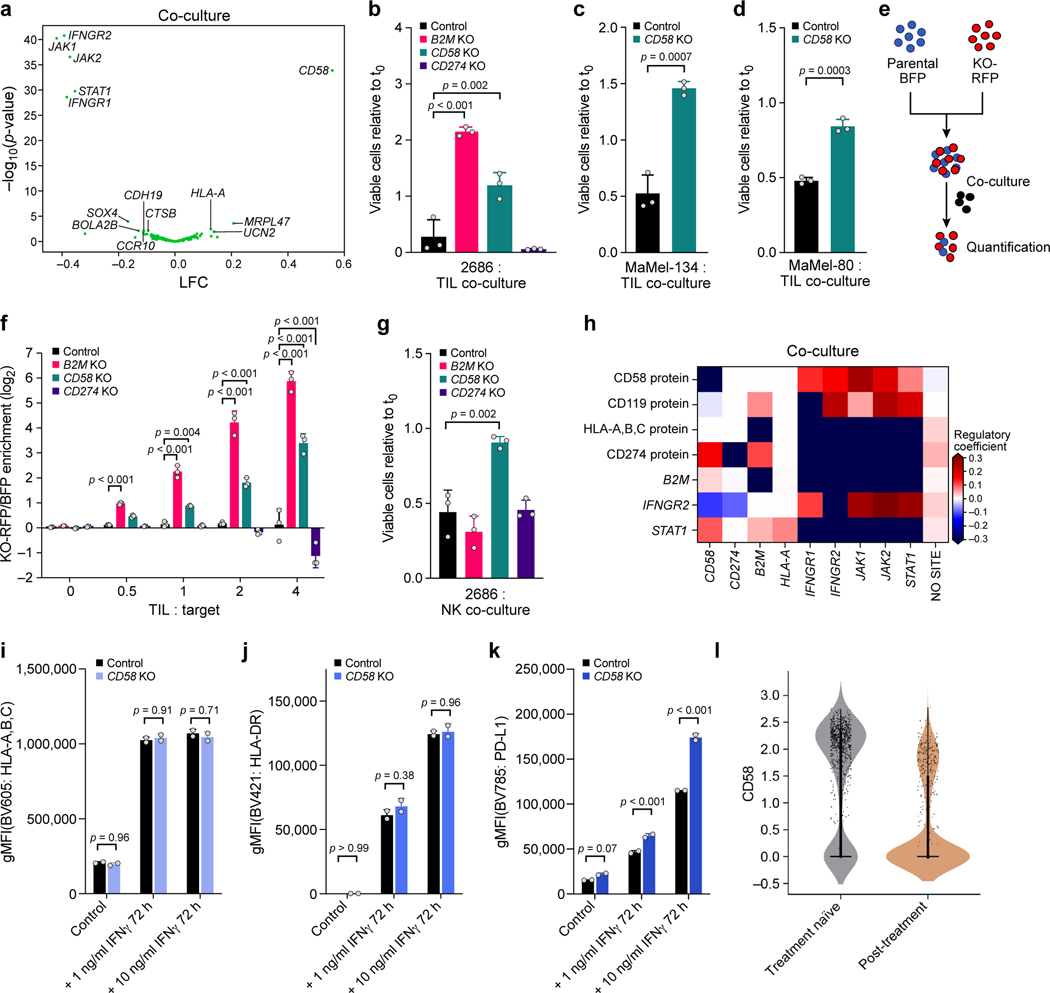
Figure 5. CD58 loss is a distinct mechanism of immune evasion from TIL and NK-cell mediated killing.
a.CD58 perturbation affects a distinct regulatory program. Change in signature scores of the CD58 regulatory program (x axis, LFC) and its associated significance (y axis, -log10(P-value), Welch’s t test) for each perturbation in the co-culture. b-d. Ratio of viable cancer cells (y axis, relative to t0) in co-culture models of control, CD58 KO, B2M KO and CD274 KO cells. e. Competition assay schematic. BFP-labeled parental cells and RFP-labeled KO cells are co-cultured with TILs and the RFP/BFP ratio is calculated as an estimate of relative fitness. f. Competition assay of parental cells and matched B2M KO, CD58 KO or CD274 KO after 48 hours of co-culture. g. Ratio of viable cancer cells in an NK co-culture model of parental cells compared to matched indicated genotypes. h-k. CD58 perturbation in co-culture does not affect B2M and HLA expression at the RNA and protein level but induces CD274. h. Regulatory effect ( values from the model shown in a; red/blue: perturbation induces/represses gene feature) in Perturb-CITE-Seq on key RNA and protein (CITE) features (rows) when perturbing different genes in the JAK-STAT pathway, CD58 or CD274 (columns). i-k. Surface expression of MHC class-I (i), MHC class-II (j) or CD274 (k) at baseline and after stimulation with different levels of IFNγ for 72 hours, in parental and CD58 KO cells. l. Distribution of expression levels (y axis, log2(TPM+1)) of CD58 RNA in melanoma cells from tumors in patients who were either treatment naïve (gray) or were resected after failure of immunotherapy (tan) in the scRNA-seq data from the ICR-signature discovery cohort9. One-way ANOVA with Tukey post hoc test in b, f, g, two-sided t test in c,d, and i-k. Error bars: Mean ±SD. All experiments were performed in triplicates (except i-k in duplicates) in each of at least two independent experiments.

