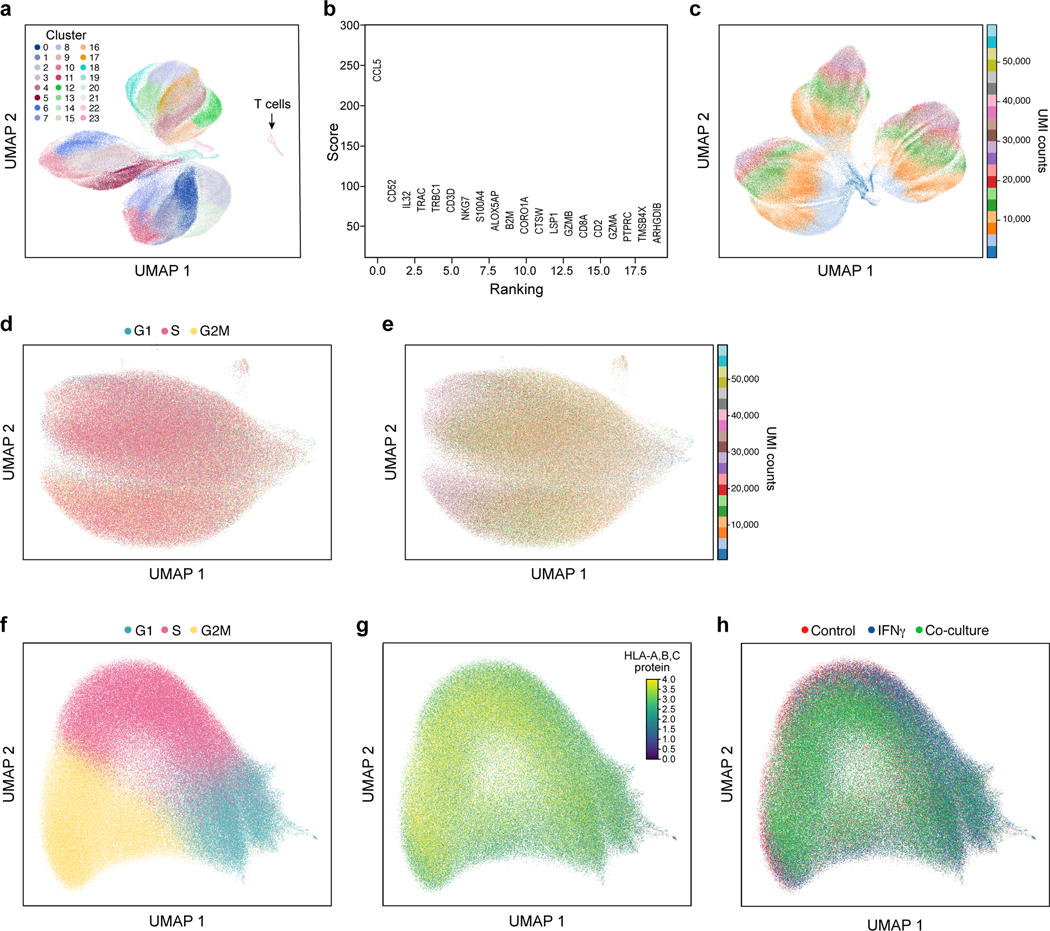
Extended Data Fig. 4. Characterization of different immune pressures by single-cell RNA and protein profiles.

a,b, Removal of profiled T cells. a. UMAP embedding of single cell RNA-Seq profiles from the Perturb-CITE-seq screen, colored by unsupervised cluster assignment34 (Methods). b, A permutation test was used to score marker genes associated with each cluster shown in (a)35. Score (y axis, permutation test, Methods) of marker genes (x axis) associated with the distinct cluster marked by an arrow in (a), include canonical T cell markers. c, Cell complexity affects scRNA-Seq profiles. UMAP embedding of scRNA-Seq profiles of cancer cells only, colored by UMI count bins. d,e, CITE profiles of 20 cell surface proteins do not reflect cell cycle phases (d) or UMI count (e). UMAP embedding of cells (dots) by CITE-seq profiles (dots) colored by cell cycle phase, as scored from scRNA-Seq of the cells, and (e) UMAP of cells by count bins (indicated in legend). f-h, Limited relation between the cell cycle and immune pressure or phenotype. UMAP embedding of cells (dots) based only on RNA expression on cell cycle genes colored by (f) cell cycle phase based on the cell’s RNA profile; (g) MHC protein levels from the CITE signal of the cell; or (h) condition.
