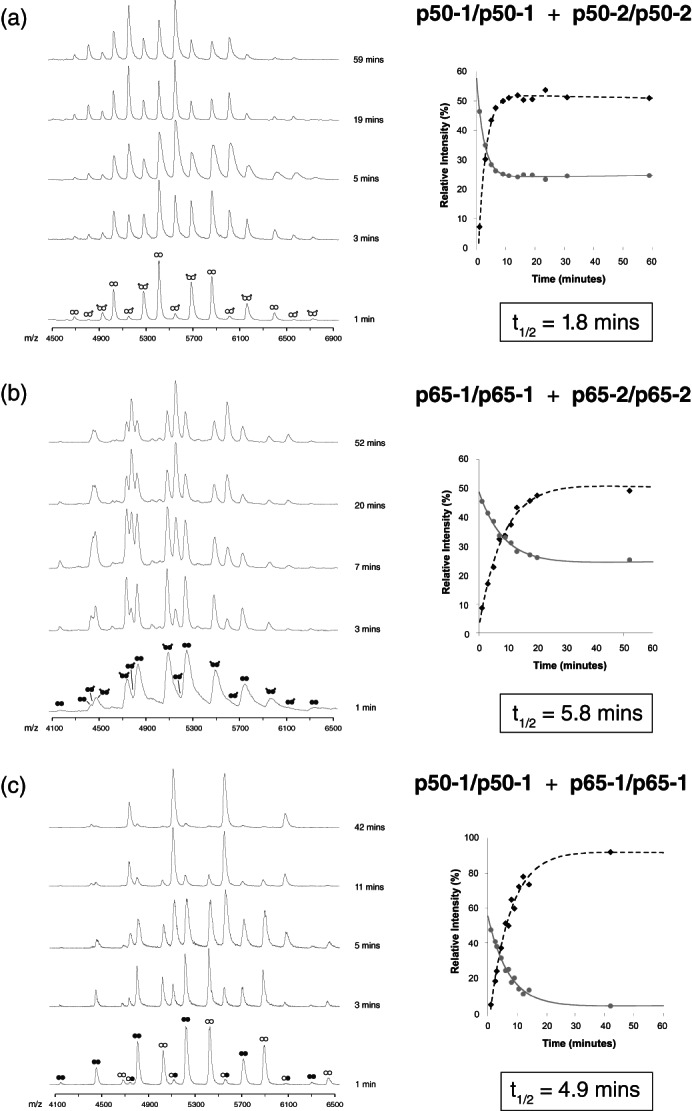
FIGURE 3.

Subunit exchange between Rel dimers at 37 °C. (a) ESI‐MS time‐course of subunit exchange between p50‐1/p50‐1 (white circles) and p50‐2/p50‐2 (white circles with tails) RHD homodimers. The panel insert shows the relative populations of each species from 0‐60 minutes. (b) ESI‐MS time‐course of subunit exchange between p65‐1/p65‐1 (black circles) and p65‐2/p65‐2 (black circles with tails) RHD homodimers. The panel insert shows the relative populations of each species from 0‐60 minutes. (c) ESI‐MS time‐course of subunit exchange between p50‐1/p50‐1 (white circles) and p65‐1/p65‐1 (black circles) RHD homodimers. The panel insert shows the relative populations of each species from 0‐60 minutes. For Figure 3a‐c, note that values obtained for the homodimeric species have been averaged to generate the decay curve. ESI, electrospray ionization; MS, mass spectrometry; RHD, Rel homology domain
