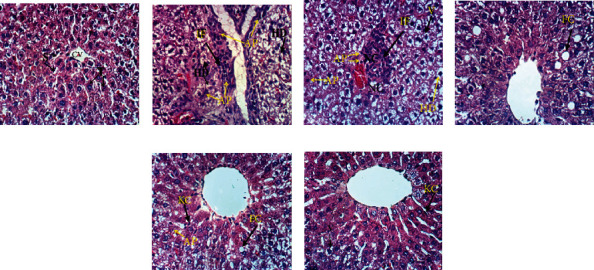
Figure 3.

Photomicrographs of liver sections of the normal (a), diclofenac-injected group (b, c), and diclofenac-injected groups treated with naringin (d), hesperidin (e), and their combination (f). T: trabeculae; S: sinusoids; CV: central vein; IF: inflammatory cell infiltration; HD: hydropic degeneration; AP: apoptosis; NC: necrosis; FC: fatty changes; V: vacuolization; KC: Kupffer cells (H&E; ×400).
