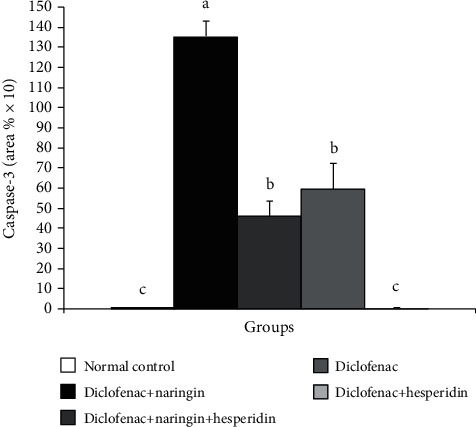
Figure 5.

Immunohistochemical staining intensity of caspase-3 in the liver of the normal control, diclofenac control group, and diclofenac groups treated with naringin and/or hesperidin. Means, which share different symbols, are significantly different at p < 0.05.
