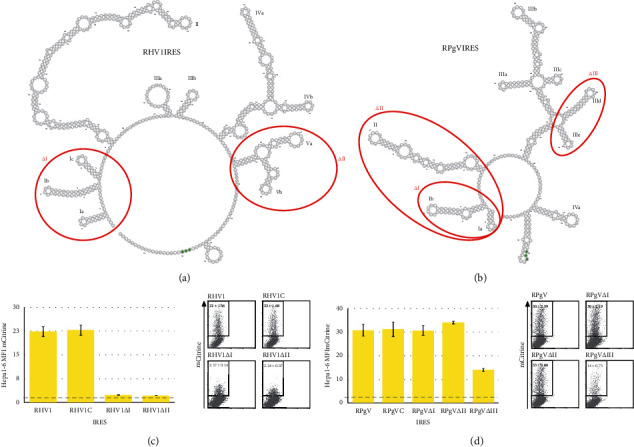
Figure 3.

Deletions to RHV1 and RPgV 5′ UTR abrogate IRES translation. Predicted RNA secondary structure of RHV1 (a) and RPgV (b). Red circles indicate areas deleted from plasmids. Hepa1-6 cells were transfected with RHV1 (c) and RPgV (d) plasmids. Cells were harvested and analysed by flow cytometry at 48 h.p.t. Bar graphs show MFI for mCitrine (n ≥ 8, mean ± SEM of at least three independent experiments) and representative FACS plots on the right of each graph; numbers represent the MFI (mean ± SEM). The dashed line represents the fluorescent output of the control plasmid containing a scrambled sequence in place of the viral 5′ UTR.
