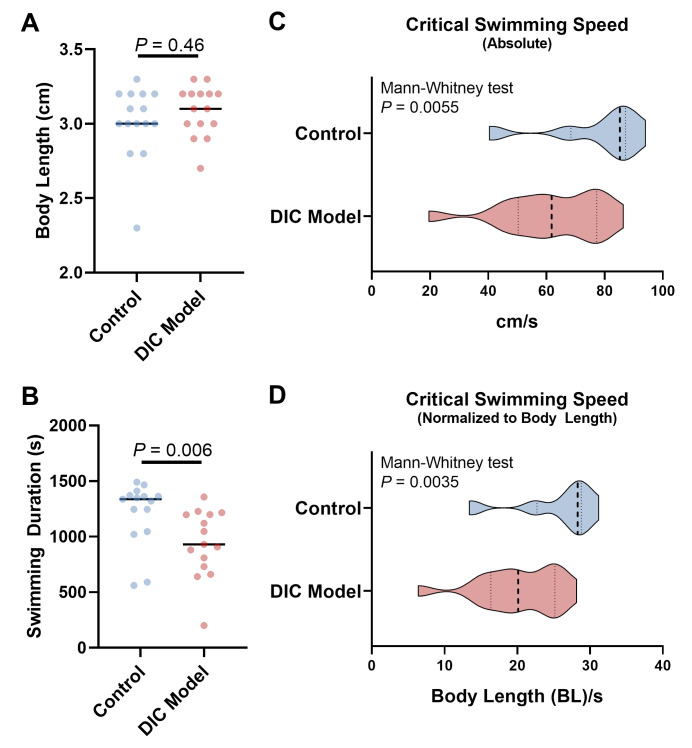
Figure 4. Representative data comparing the swimming indices between doxorubicin-induced cardiomyopathy (DIC) model and control adult zebrafish.
A. Comparison of body length. B. Comparison of total swimming time in the tunnel. This does not include the 20-min acclimation time at 200 RPM. C. Comparison of the absolute critical swimming speed. D. Comparison of the critical swimming speed normalized to body length. BL/s represents the folds of body length per second. In C and D, the violins show the distribution of critical swimming speeds from 15 fish in each group. Dashed lines indicate the median (thicker) and 25th and 75th quartiles.

