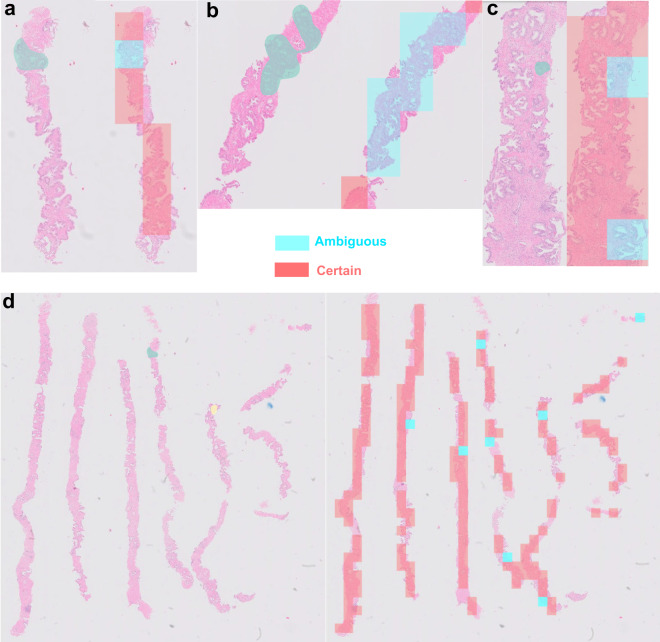
Fig. 4. Example application of the tile classifier on the tissue areas of an unseen whole H&E slide (from the validation dataset).
In a–d, the results are compared to foci annotated by pathologists. Red denotes tiles classified as certain, while blue denotes tiles classified as ambiguous. a–c Show the overlap between pathologist annotation and the classifier output. The classifier marks as ambiguous regions that were identified by pathologists. d is an example of the tile classifier output for a WSI.

