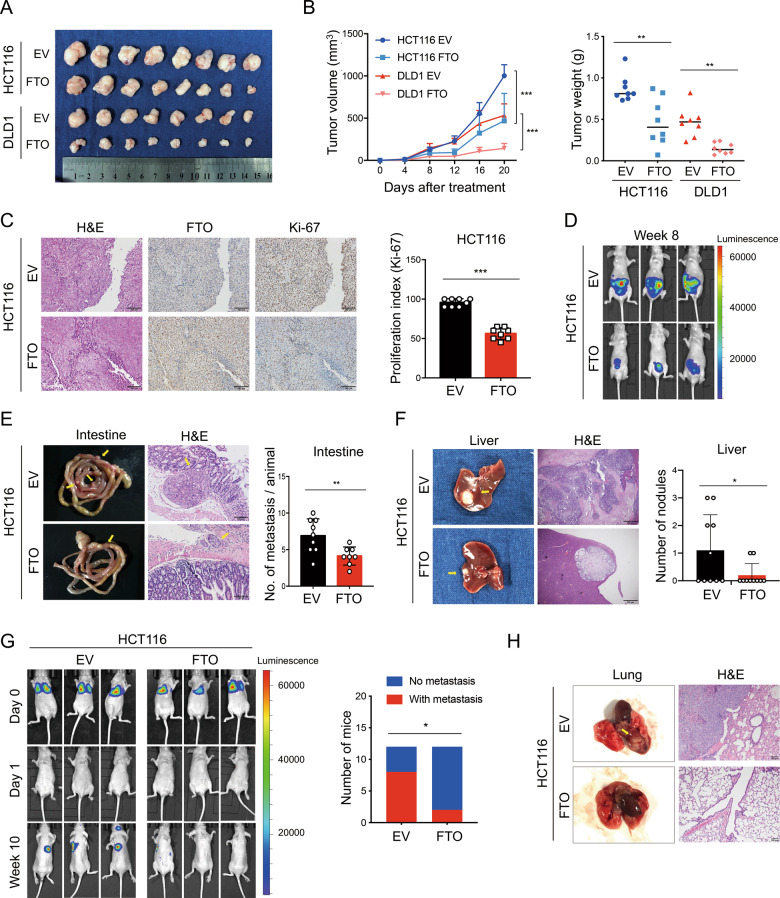
Fig. 3. FTO inhibits CRC cell metastasis in vivo.
A, B Photograph and quantification of excised subcutaneous tumors by implanting FTO-overexpressing (FTO) versus control empty vector (EV) HCT116 and DLD1 cells (n = 8 mice per group). Two-way ANOVA and t test analysis were applied for comparisons of tumor growth rate (left) and tumor weight (right), respectively. C Representative images of hematoxylin and eosin (H&E) staining and IHC staining of FTO and Ki-67 antibodies in paraffin-embedded mouse subcutaneous tumor sections derived from the HCT116 FTO and EV groups. Scale bar: 100 μm (left). The Ki-67 proliferation index (percent Ki-67-positive) was quantified in tumor sections from the FTO and EV groups (n = 8 mice per group), and the two-tailed Student’s t test was used for comparisons (right). D The bioluminescent imaging of nude mice orthotopic tumor model with FTO and EV luciferase-labeled HCT116 cells (n = 10 mice per group). E Representative images of intestinal metastatic nodules and H&E staining in FTO and EV groups were shown (left) and quantification were analyzed by Student’s t test (right). F Representative specimens and H&E staining photographs of liver metastatic nodules were shown (left) and quantification were analyzed by Student’s t test (right). G The bioluminescent imaging of nude mice tail vein injection metastasis model with FTO and EV luciferase-labeled HCT116 cells at days zero, one and week ten (n = 12 mice per group). Tumor metastasis formation were followed at week ten and distant metastasis in FTO and EV groups were analyzed by Pearson’s chi-square test. H Representative specimen and H&E staining photographs of the metastatic nodules in the lung. *P < 0.05, **P < 0.01, ***P < 0.001.

