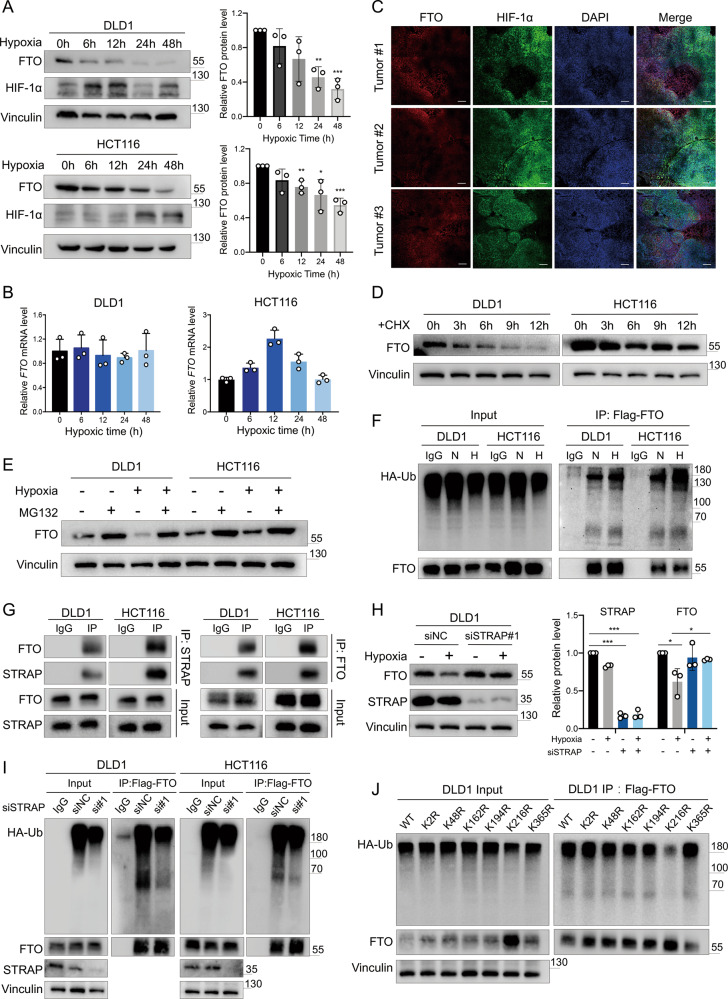
Fig. 7. Hypoxia inhibits FTO expression in CRC.
A Immunoblotting of FTO and HIF-1α levels in DLD1 cells after exposure to hypoxic conditions at several time points (0, 6, 12, 24, 48 h) (left). Relative FTO protein levels (versus Vinculin) (right). B Relative FTO mRNA level in DLD1 and HCT116 cells after exposure to hypoxic conditions at different time points. C Representative fluorescence overlay images of FTO and HIF-1α expression in mouse HCT116 induced subcutaneous tumor tissue. The yellow color in the merged images indicates the colocalization of FTO and HIF-1α. Scale bar: 200 μm D Immunoblotting of FTO levels in DLD1 and HCT116 cells followed by treatment with CHX (100 μg/mL) for the indicated times (0, 3, 6, 9, 12 h). E Immunoblotting of FTO levels in DLD1 and HCT116 cells cultured under normoxia or hypoxia for 24 h and treated with DMSO or 10 μM MG132 for 12 h. F Representative immunoblotting of ubiquitinated FTO from the IP assay of DLD1 and HCT116 cells which were co-transfected with HA-tagged Ub plasmid and Flag-tagged FTO plasmid, then exposed to normoxic (N) and hypoxic (H) conditions for 24 h. G The FTO (STRAP) proteins were immunoprecipitated with STRAP (FTO) antibody in DLD1 and HCT116 cells, while IgG pulldown was used for IP control. The immunoblots were probed with FTO and STRAP antibodies to test the interaction between FTO and STRAP. H Immunoblotting (left) and relative FTO and STRAP protein levels (right) after STRAP knockdown in DLD1 cells exposed to 21% oxygen and 1% oxygen for 24 h. I The immunoblotting of the ubiquitination assay from DLD1 and HCT116 cells after STRAP knockdown and co-transfected with HA-tagged Ub plasmid and Flag-tagged FTO plasmid. J Representative immunoblotting of the ubiquitination assay from wild type (WT) or mutant DLD1 cells which were co-transfected with HA-tagged Ub plasmid and Flag-tagged FTO plasmid under hypoxia for 24 h. Data in (A, B, and H) are presented as the means ± S.D. (n = 3) *P < 0.05, **P < 0.01, ***P < 0.001. (Student’s t test).

