Fig. 4.
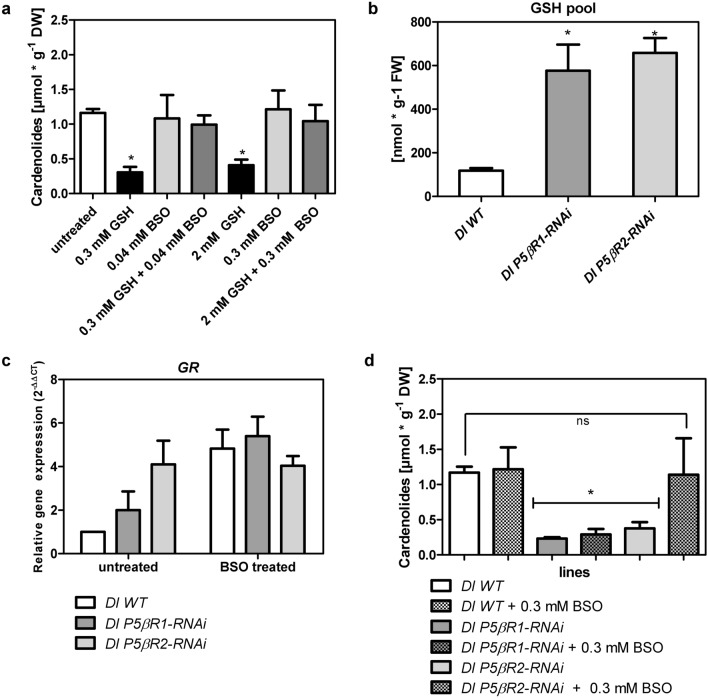
Effects of glutathione (GSH) and buthionine sulfoximine (BSO) treatment. a Effects of GSH and BSO alone or a combination on cardenolide level in D. lanata WT shoots; b estimated GSH pool in Dl WT and Dl P5βR-RNAi knockdown lines calculated by measuring t-GSH and GSSG. c Relative expression of glutathione reductase (GR) in D. lanata WT and Dl P5βR-RNAi knockdown shoots either untreated or BSO treated. RNA expression levels were calculated using the qPCR method by applying the 2−ΔΔCT method with actin as the reference gene. The y axis denotes the normalized relative transcript accumulation of the GR in the individual lines indicated in the figure legend. Mean ± SEM are shown (n = 3). d Quantification of digoxigenin and digitoxigenin in Dl WT and Dl P5βR-RNAi knockdown lines treated with 0.3 mM BSO (Mean ± SEM are shown n = 3). Tukey’s test, *P > 0.05

