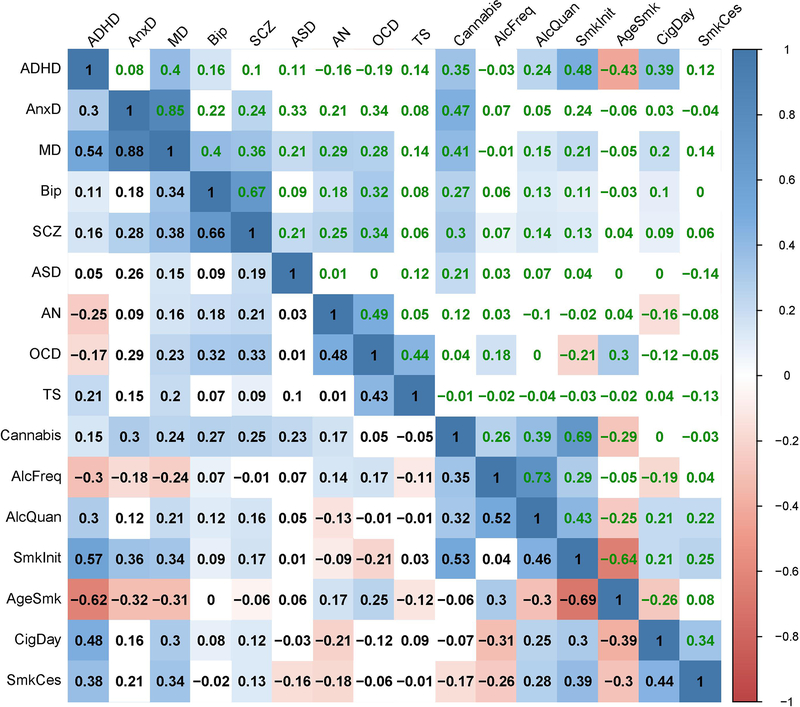
Extended Data Fig. 9. The genetic correlations before (lower diagonal in black type) and after (upper diagonal in green type) partialling out genetic variance of household income.
Coloured squares indicate significant genetic correlations (FDR corrected, see methods).

