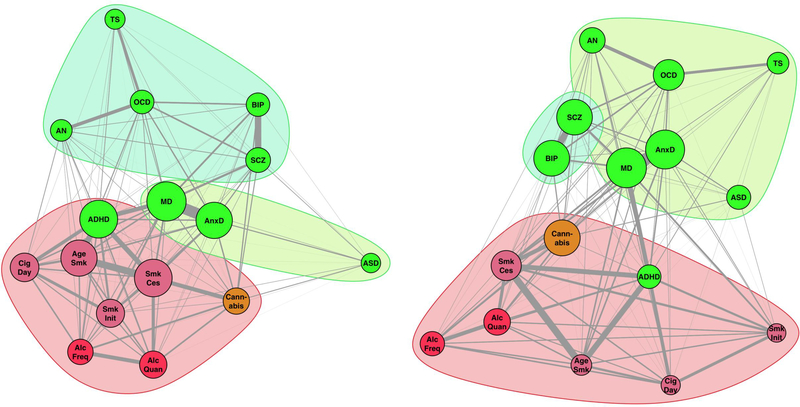
Figure 5.
SNP-based genetic correlations between the mental health traits illustrated with a graph to reveal complex genetic relationships. Each vertex (node) represents a mental health trait, with green nodes representing psychiatric disorders and reddish nodes the substance use traits (red for alcohol, orange for cannabis, and lilac for smoking related traits). Vertex size is based on eigenvector centrality with a minimum offset. Weighted undirected graphs were created with the absolute genetic correlation as connection strength (represented in line thickness). Vertex layout was based on the Fruchterman and Reingold algorithm73. Left; Graph before removing genetic SES variance resulted in three clusters (Clustering coefficient Q=0.251). Right; Graph after removing genetic SES variance showed an increased clustering index (Q=0.321), reshaped psychiatric genetic clusters, and kept the substance use cluster intact (including ADHD).

