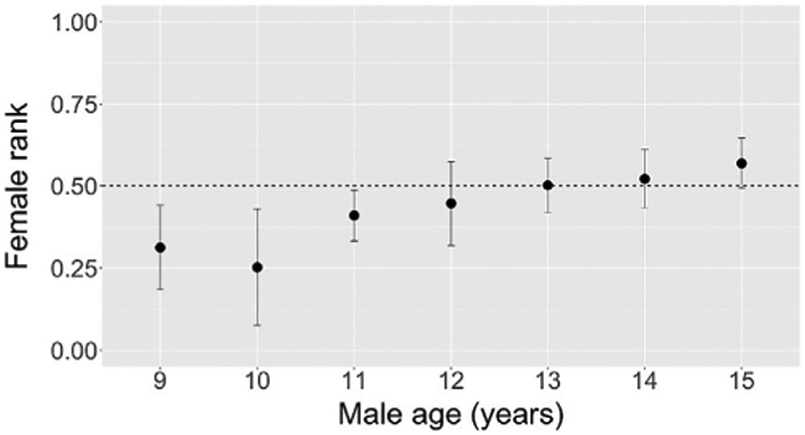
FIGURE 4.

Ranks of females against whom males initiated aggression at ages nine through 15 years. Each point represents the mean rank of females who were aggressive targets of a male at a given age (yearly average). The plot contains 52 male-years across 10 males. Error bars represent one standard deviation above and below the mean. The x-axis range of 9–15 years spans from the earliest age that any male dominated a female to the age of male adulthood, by which time most males had dominated all females
