
Figure 3. Mechanistic details revealed by ketanserin pretreatment and electrophysiological characterizations.
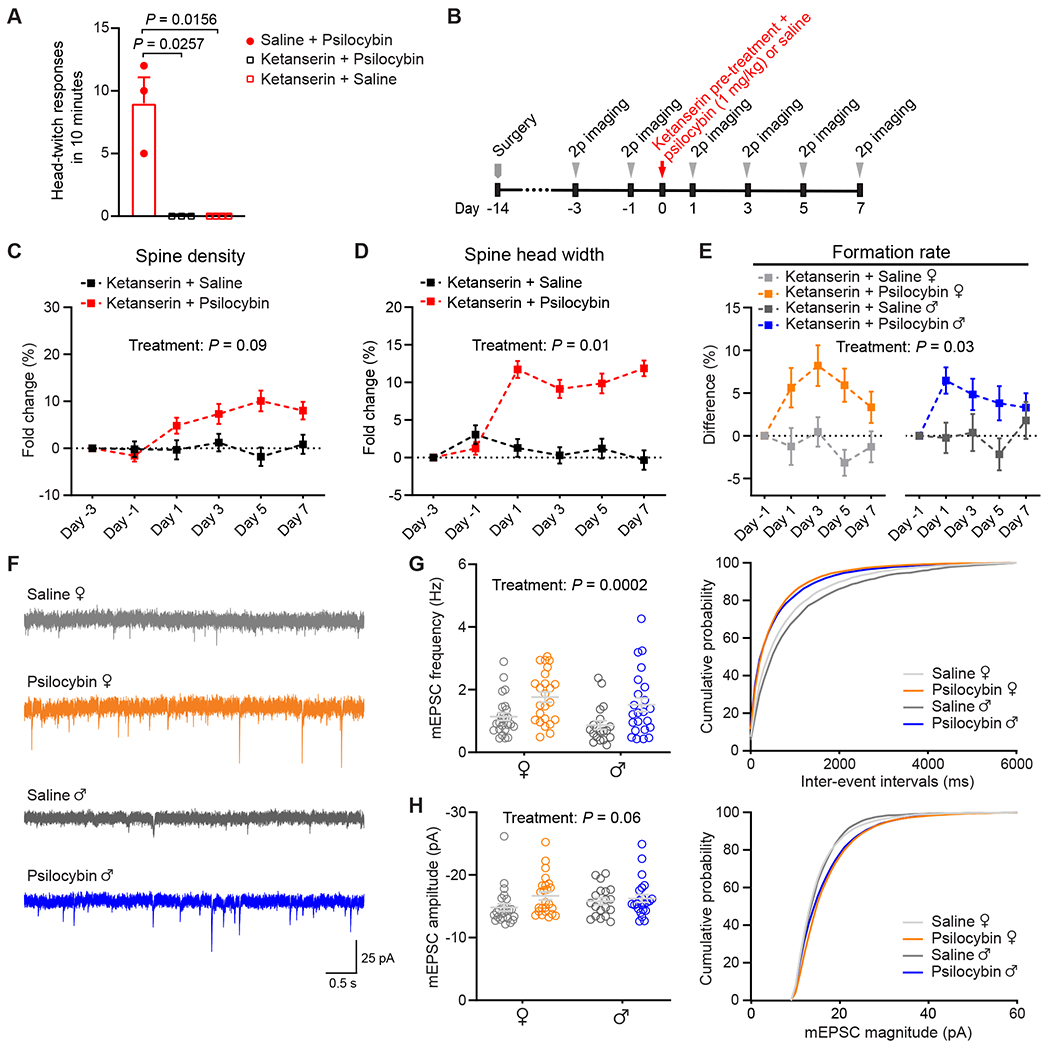
(A) Head-twitch responses after administrating psilocybin without saline pre-treatment (10 min prior; n = 3 mice), psilocybin (1 mg/kg, i.p.) with ketanserin pre-treatment (1 mg/kg, 10 min prior; n = 3), and saline with ketanserin pre-treatment (n = 4). (B) Timeline for the experiment. (C) Effects of psilocybin or saline treatment on spine density in animals pretreated with ketanserin, plotted as fold-change from baseline value on Day -3. Mean ± SEM. (D) Similar to (C) for spine head width. (E) Effects of psilocybin or saline treatment on the formation rates of dendritic spines for female and male mice pretreated with ketanserin, plotted as difference from baseline value on Day -1. (F) Representative traces of mEPSCs recorded from putative layer 5 pyramidal neurons of Cg1/M2 in brain slices. (G) Grouped and cumulative distribution plots of mEPSC frequency for animals that received psilocybin or saline 24 h before recording. Each open circle denotes a cell (n = 25 cells from 4 females for saline; 24 cells from 4 females for psilocybin; 19 cells from 5 males for saline; 23 cells from 4 males for psilocybin). (H) Similar to (G) for mEPSC amplitude. Sample sizes and details of the statistical analyses are provided in Table S1. See also Figure S3.