
Figure 4. Region-specific effects of psilocybin.
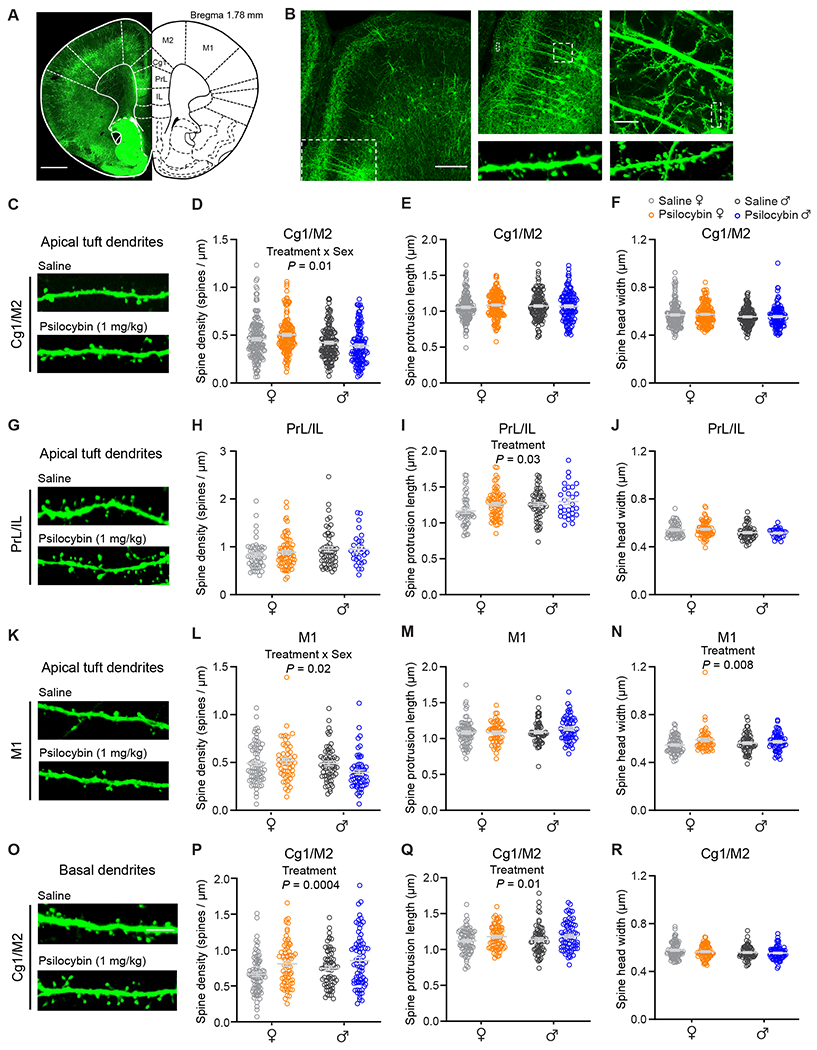
(A) Stitched confocal image of a coronal brain section from a Thy1GFP mouse. (B) Magnified images showing apical and basal dendritic segments. (C) Images of apical dendrites in Cg1/M2. (D) Effects of psilocybin and saline on spine density for apical dendrites in Cg1/M2. Open circles, individual dendritic segments. Gray line, mean ± SEM. (E) Similar to (D) for spine protrusion length. (F) Similar to (D) for spine head width. (G – J) Similar to (C – F) for PrL/IL. (K – N) Similar to (C – F) for M1. (O – R) Similar to (C – F) for basal dendrites in Cg1/M2. Sample sizes and details of the ANOVA models are provided in Table S1. See also Figure S4.