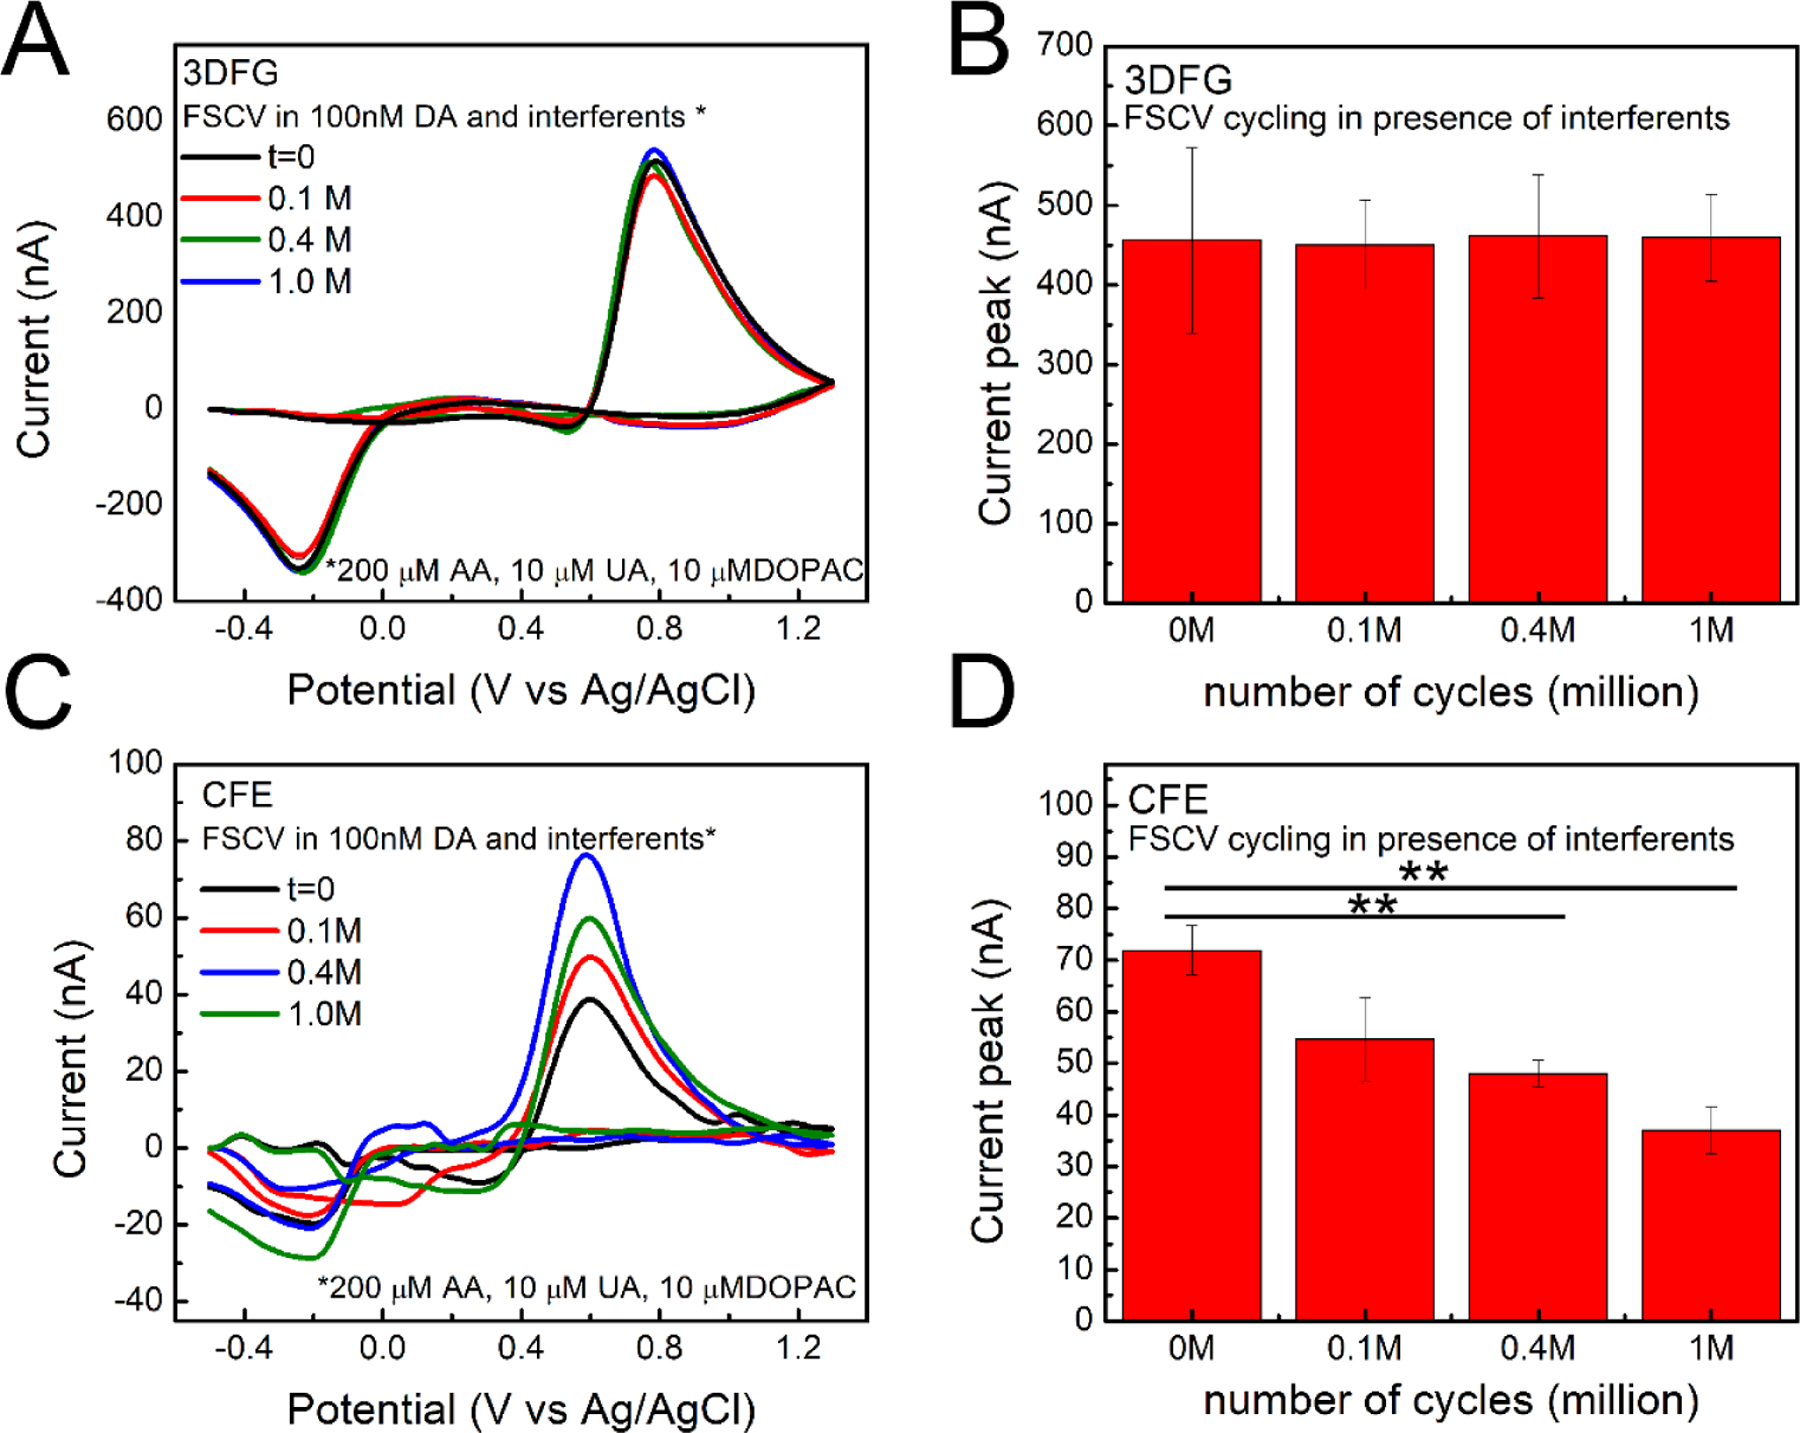
Figure 5. DA sensing stability and fouling properties with 3DFG and CFEs in presence of contaminant.

(A, B) 3DFG: (A) Representative background subtracted CVs in response to 1μM bolus injections of DA at the time 0 and after 0.1, 0.4 and 1 million (corresponding to 3, 8, and 24 hours) of 3DFG FSCV continuous scanning in PBS containing 100 nM DA and contaminants (200 μM AA, 10 μM UA, 10 μM DOPAC). (B) Column plot reporting the amplitude of the oxidation peaks collected in response to 1μM bolus injections of DA at time zero and after 0.1, 0.4 and 0.9 million of 3DFG FSCV continuous scanning in PBS containing 100 nM DA and contaminants (200 μM AA, 10 μM UA, 10 μM DOPAC), (Repeated measurements ANOVA, F(3,12)=0.05014, P=0.98443>0.05, Bonferroni post-test not stat different, n=3, 5 repetitions) (C, D) CFEs: (C) Representative background subtracted CVs in response to 1μM bolus injections of DA at the time 0 and after 0.1, 0.4 and 0.9 million of CFE FSCV continuous scanning in PBS containing 100 nM DA and contaminants (200 μM AA, 10 μM UA, 10 μM DOPAC). (D) Column plot reporting the amplitude of the oxidation peaks collected in response to 1μM bolus injections of DA at time zero and after 0.1, 0.4 and 0.9 million of CFE FSCV continuous scanning in PBS containing 100 nM DA and contaminants (200 μM AA, 10 μM UA, 10 μM DOPAC). (Repeated measurements ANOVA, F(3,33)=9.16405, P=1.4835E-4<0.05, Bonferroni post-test ** stat different, n=3, 5 repetitions).
