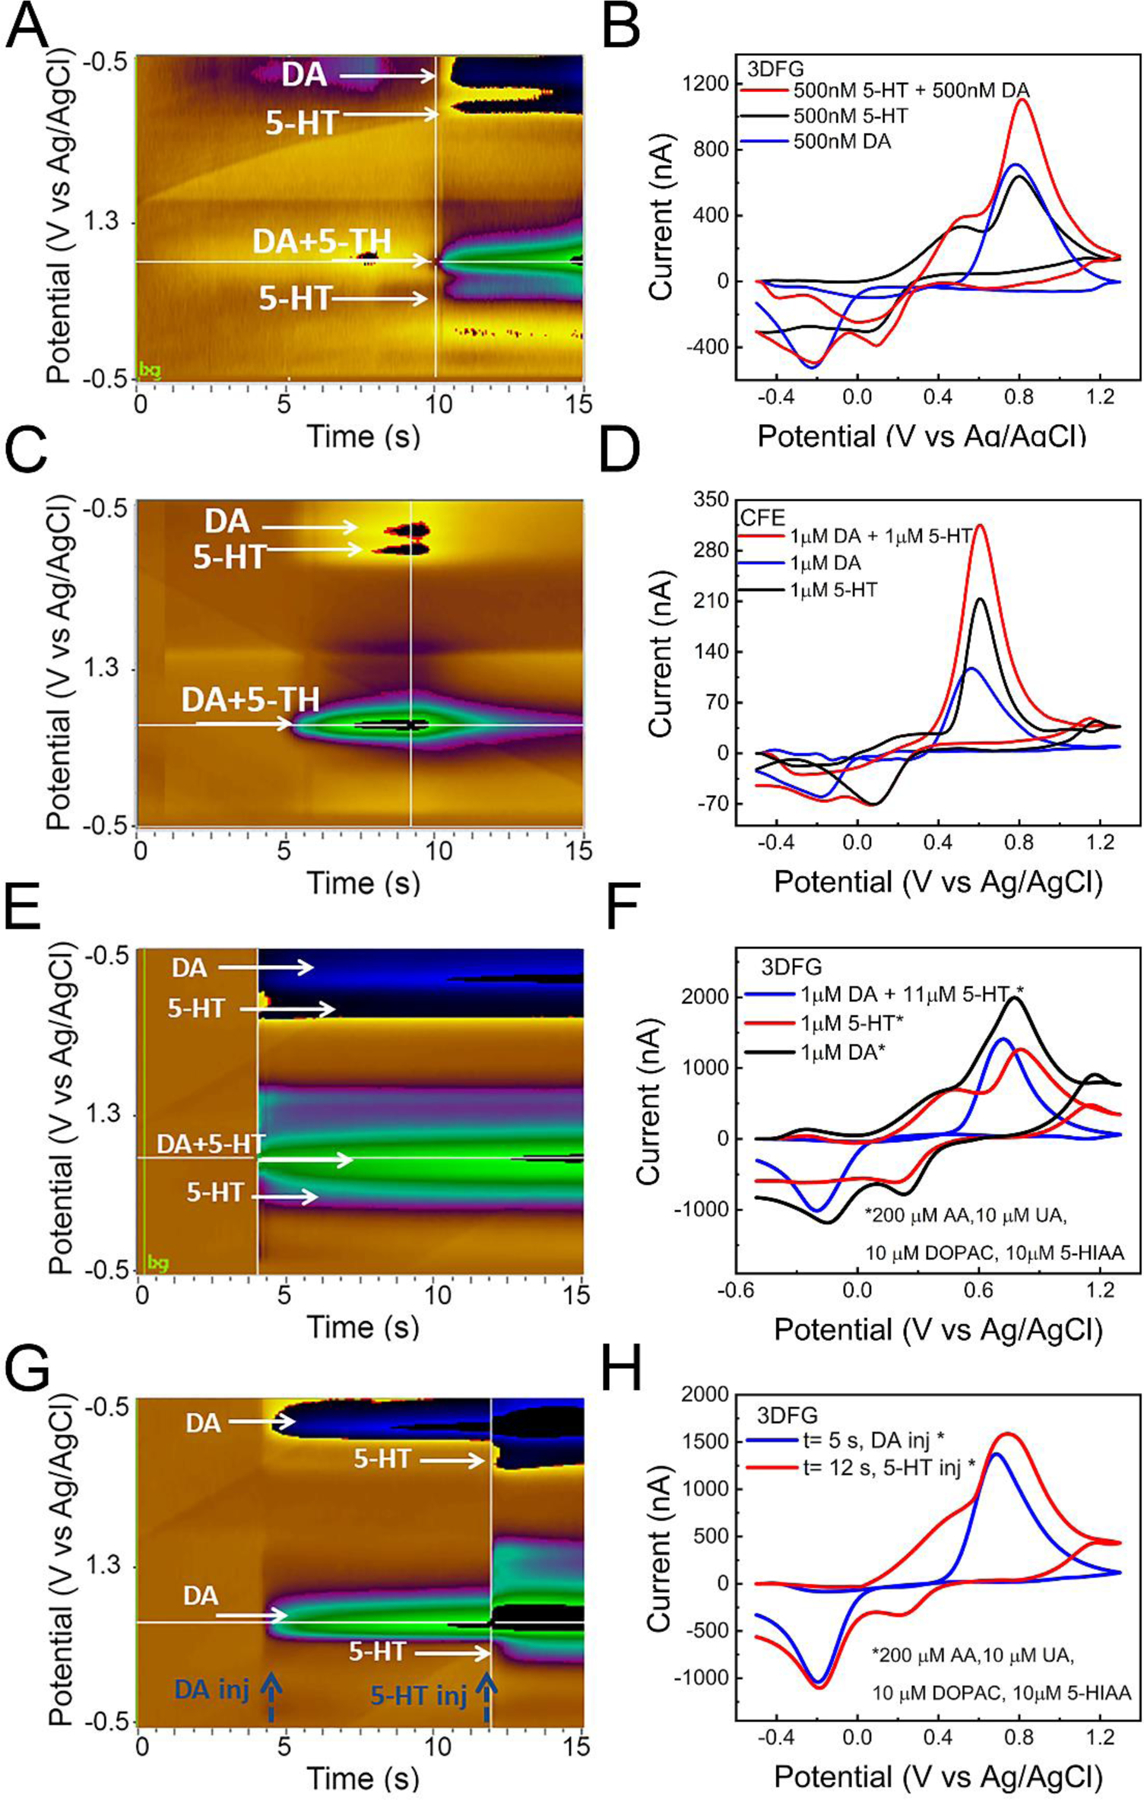
Figure 6. DA and 5-HT simultaneous detection using 3DFG and CFEs.

(A,B) 3DFG (A) A representative color plot showing clear separation peaks (reduction and oxidation) of DA and 5-HT and (B) Background subtracted CVs showing reduction and oxidation peaks of dopamine (DA), serotonin (5-HT) and their simultaneous detection (50:50% DA and 5-HT) using a standard pyramidal FSCV waveform in which the applied voltage was ramped from the holding potential of −0.5 V to the switching potential of +1.3V and then back to −0.5V at 400 V/s, at 10 Hz. 3DFG can discriminate both reduction and oxisation peaks. (C,D) CFEs. (A) Color plot for simultaneous DA and 5-HT detection showing showing clear separation only for the reduction peaks. (D) Background subtracted CV showing reduction and oxidation peaks of dopamine (DA), serotonin (5-HT) and their simultaneous detection using a standard pyramidal FSCV waveform in which the applied voltage was ramped from the holding potential of −0.5 V to the switching potential of +1.3V and then back to −0.5V at 400 V/s, at 10 Hz. (E, F) Representative color plot and background subtracted CVs showing reduction and oxidation peaks of dopamine (DA), serotonin (5-HT) and their simultaneous detection concentration in the presence of 200 μM AA, 10 μM UA, 10 μM DOPAC and 10 μM5-HIAA. DA and 5-HT were injected in a 50:50% mixture and signals were measured using a standard pyramidal FSCV waveform in which the applied voltage was ramped from the holding potential of −0.5 V to the switching potential of +1.3V and then back to −0.5V at 400 V/s, at 10 Hz. 3DFG can discriminate both reduction and oxidation of DA and 5-HT in simultaneous detection also in presence of contaminants. (G, H) Color plot and background subtracted CVs showing reduction and oxidation peaks of dopamine (DA, Injected at 5 s), and their simultaneous detection concentration in the presence of contaminants after a subsequent injection of serotonin (5-HT) at 12 s.
