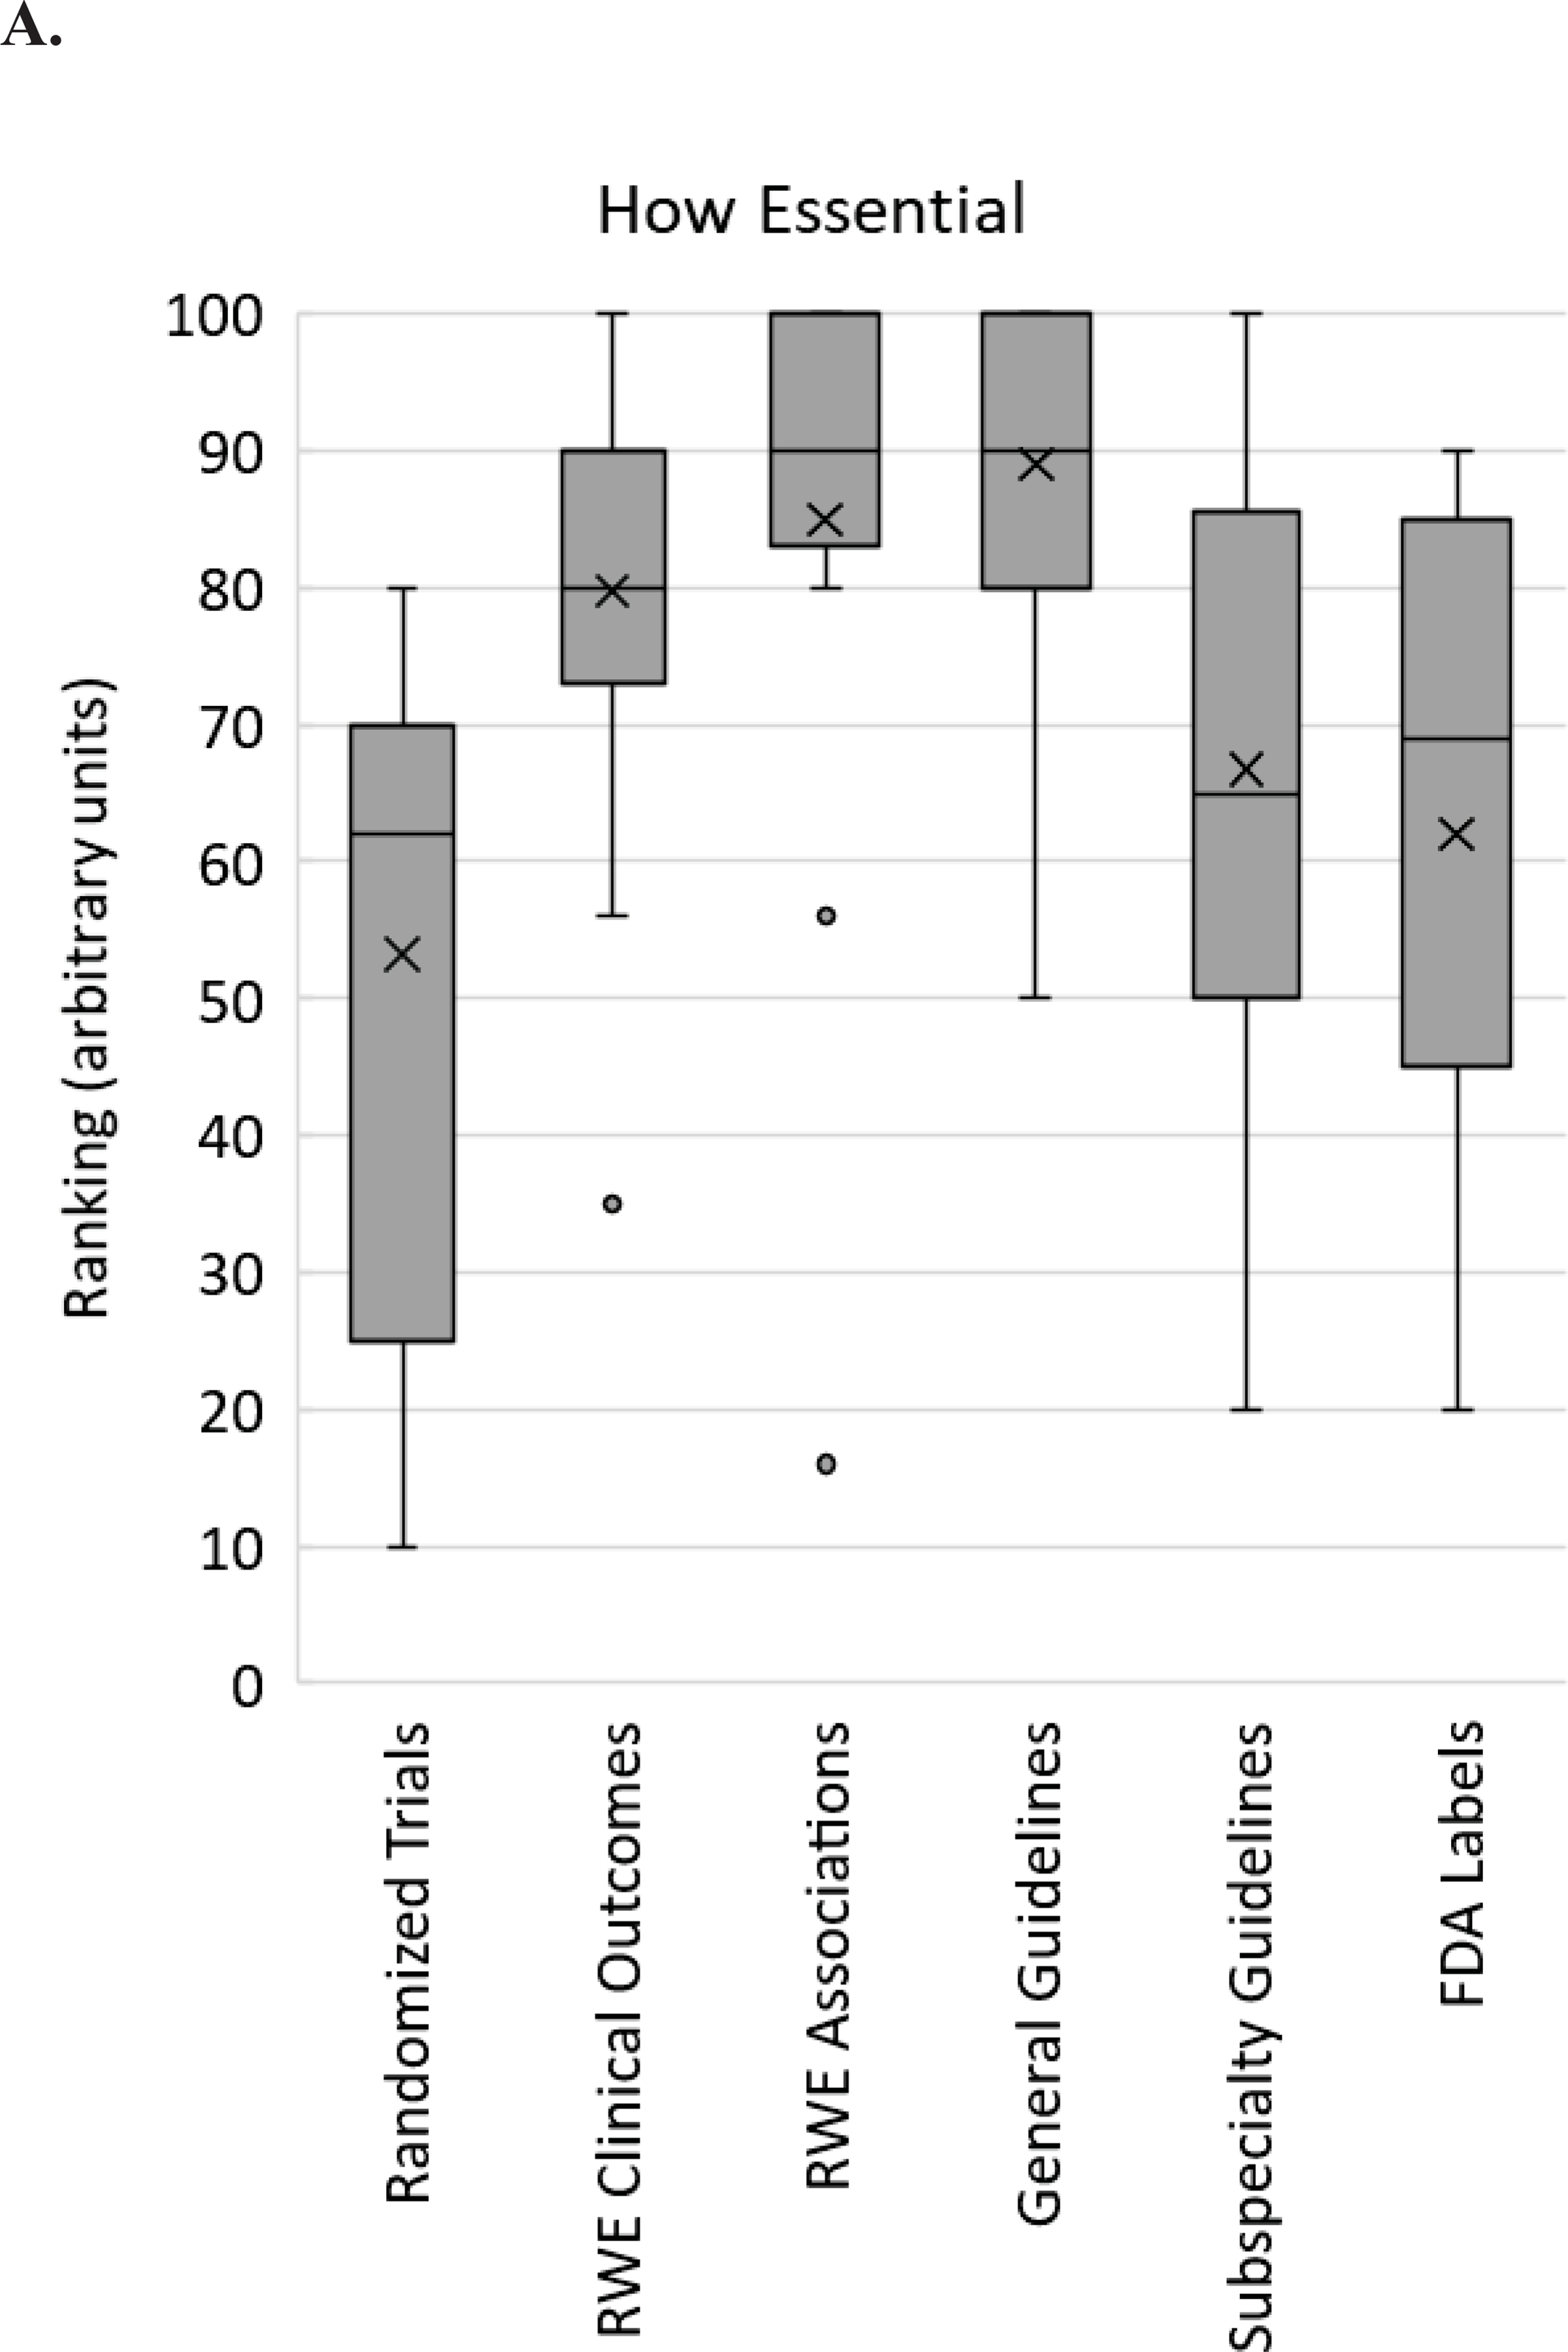
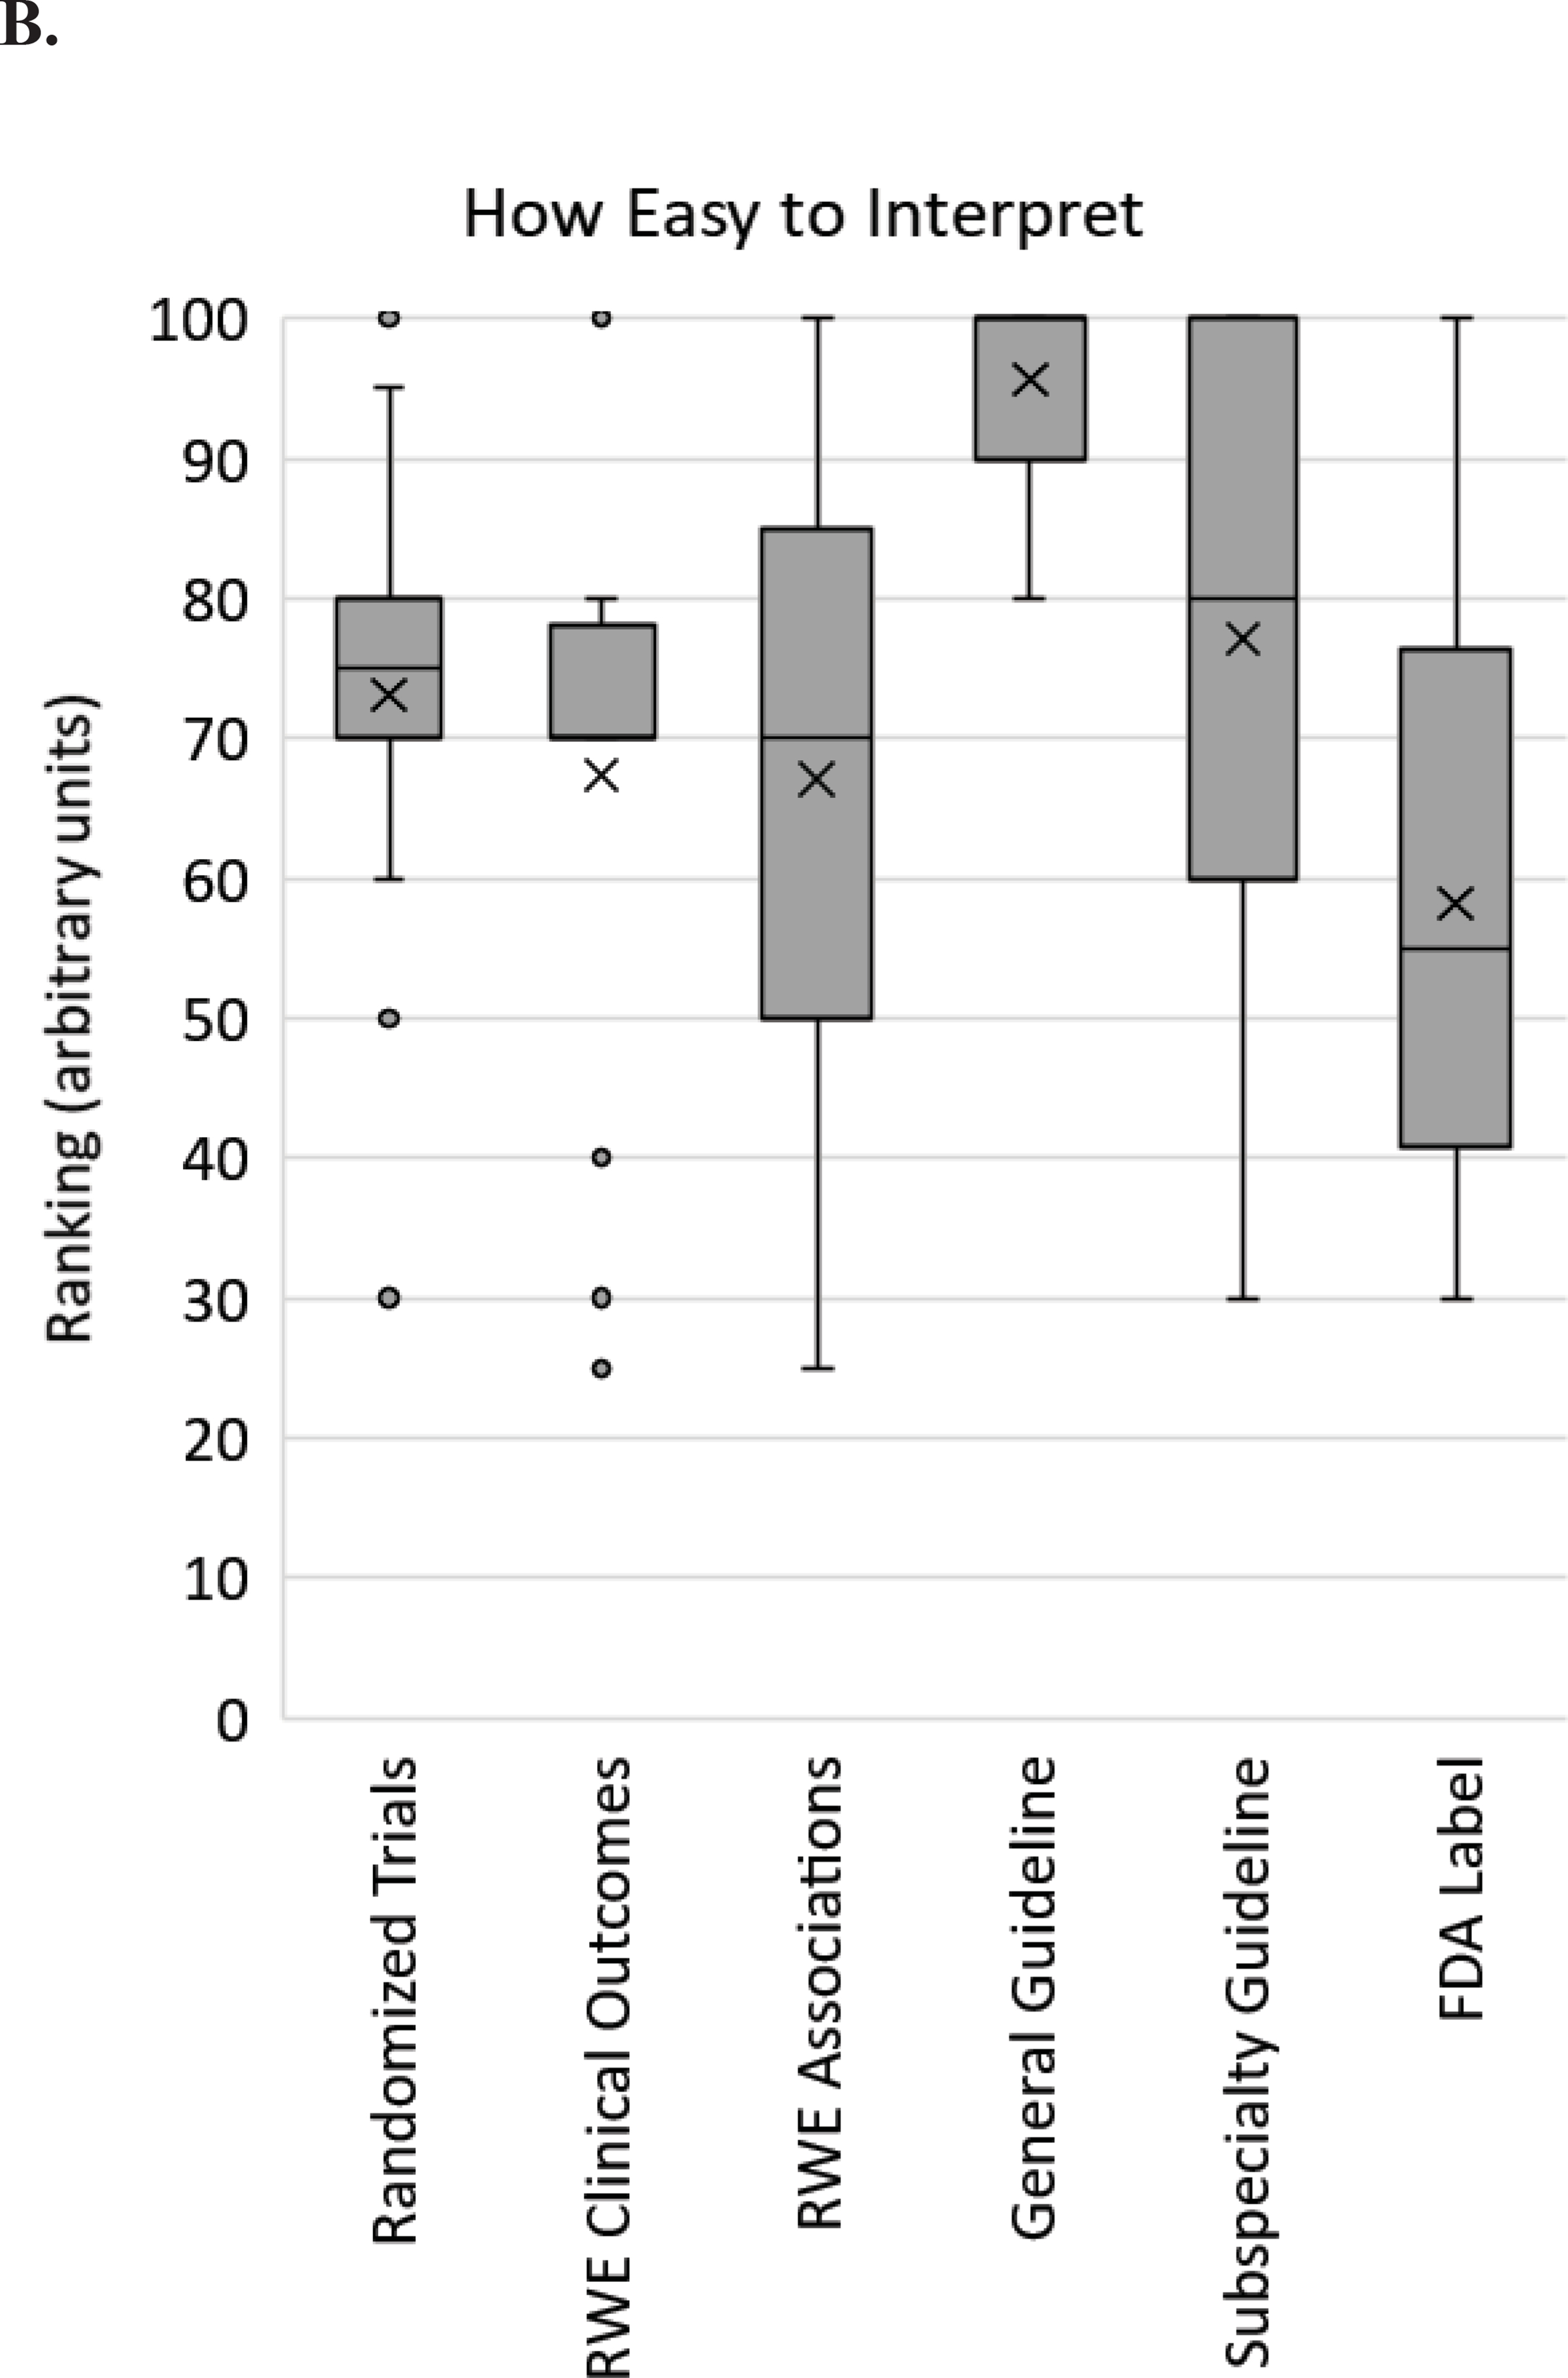
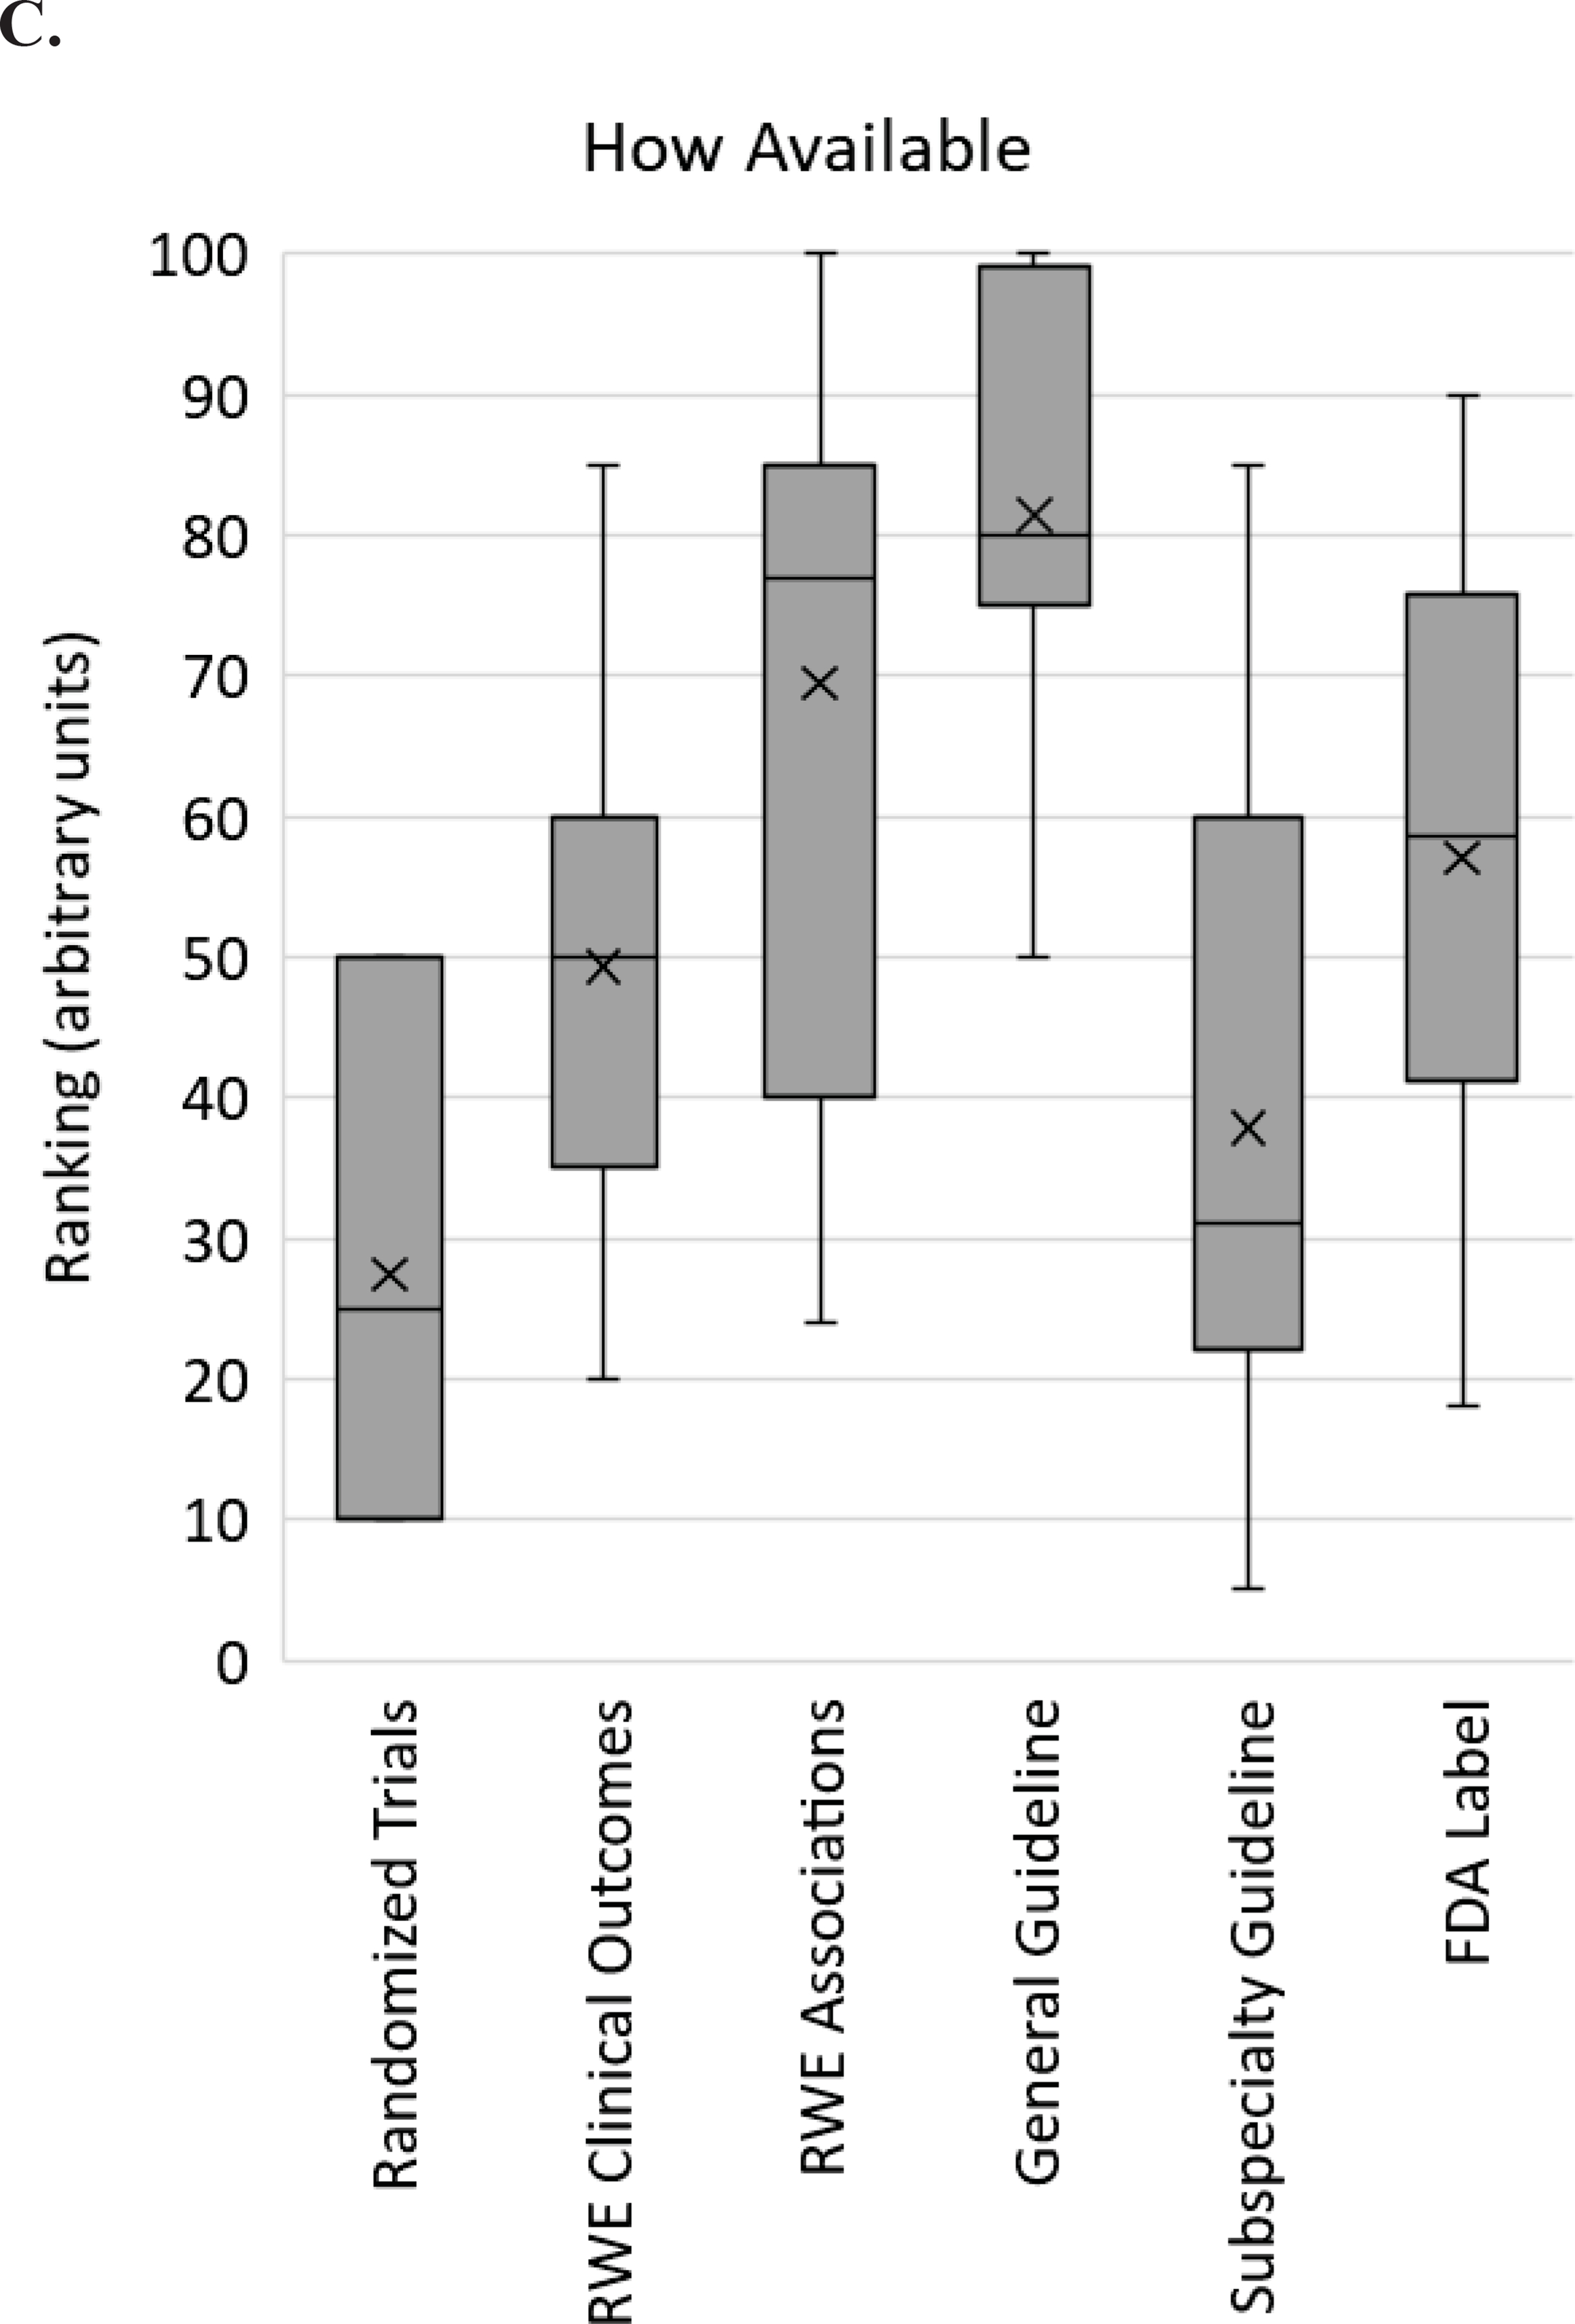
Figures 1A-C:


Survey respondent scores from implementers regarding pharmacogenomic evidence. For each of the 6 types of evidence listed on the X-axis, respondents were asked to rank how essential (A), how easy to interpret (B) and how available (C) that type of evidence is for clinical pharmacogenomic implementation on a scale from 0 to 100. The box and whisker plot shows the medians (horizontal lines within boxes), means (X), the interquartile ranges (boxes), the adjacent values (whiskers) and outliers (dots). RWE – real world evidence; FDA – Food and Drug Association.
