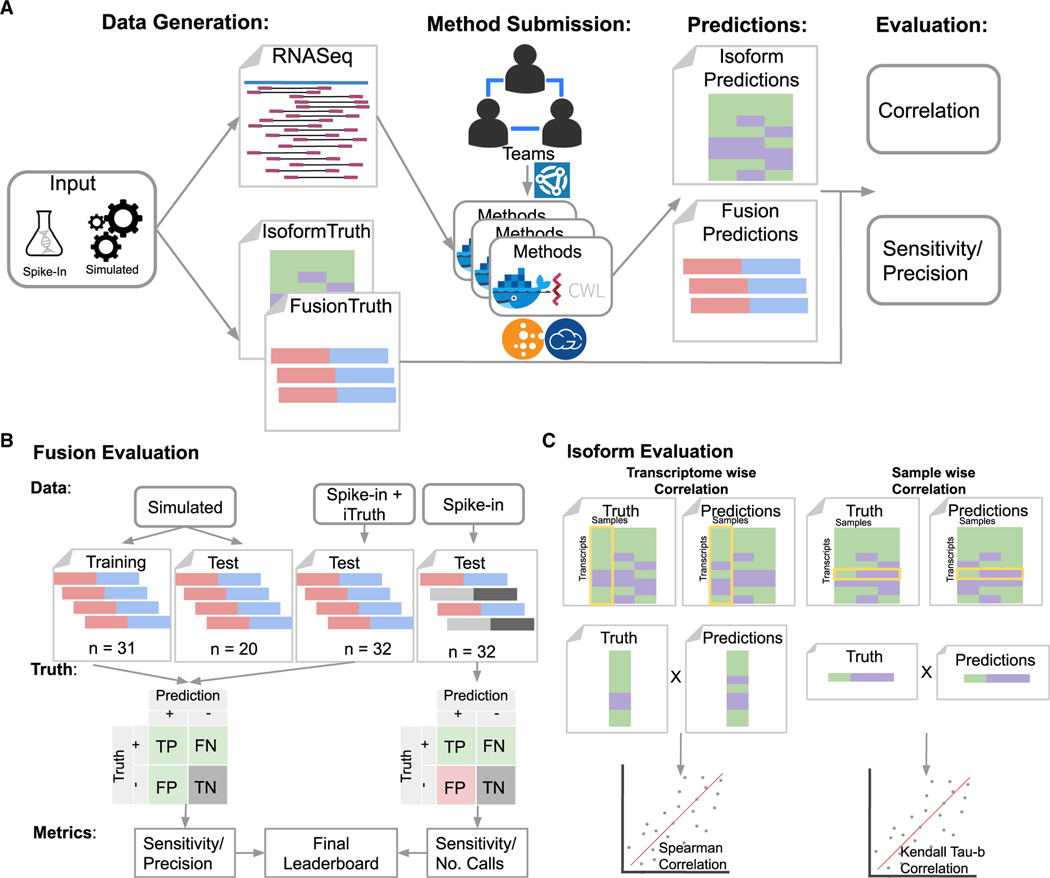
Figure 1. Overview of the challenge.
(A–C) The challenge generated simulated (or in silico) and spike-in datasets represented as RNA-seq reads (FastQ files) and ground truth. Challenge participants could submit entries (i.e., CWL workflows and Docker images) as individuals or teams using Synapse. Submitted entries were run on the FastQ files using cloud-based compute resources to generate predictions. The resulting predictions were evaluated based on statistical performance measurements. Evaluation of the Fusion Detection sub-challenge (B) used four types of input datasets to calculate sensitivity and either precision or the total number of fusion calls. Datasets where the fusion genes are known are represented as red (5’ donor) and blue (3’ acceptor), and datasets where unknown fusion genes may exist are represented as light and dark gray. The confusion matrix displays the known (green), unknown (red), and irrelevant (gray) parameters used to calculate the subsequent statistical metrics. Evaluation of the isoform quantification sub-challenge (C) used two metrics for evaluating the correlation of predictions to the truth. The transcriptome-wise evaluation compared predictions and truth in a single sample across all transcripts using a Spearman correlation. The sample-wise evaluation compared predictions and truth for a single transcript across multiple sample replicates using Kendall’s tau-β.

